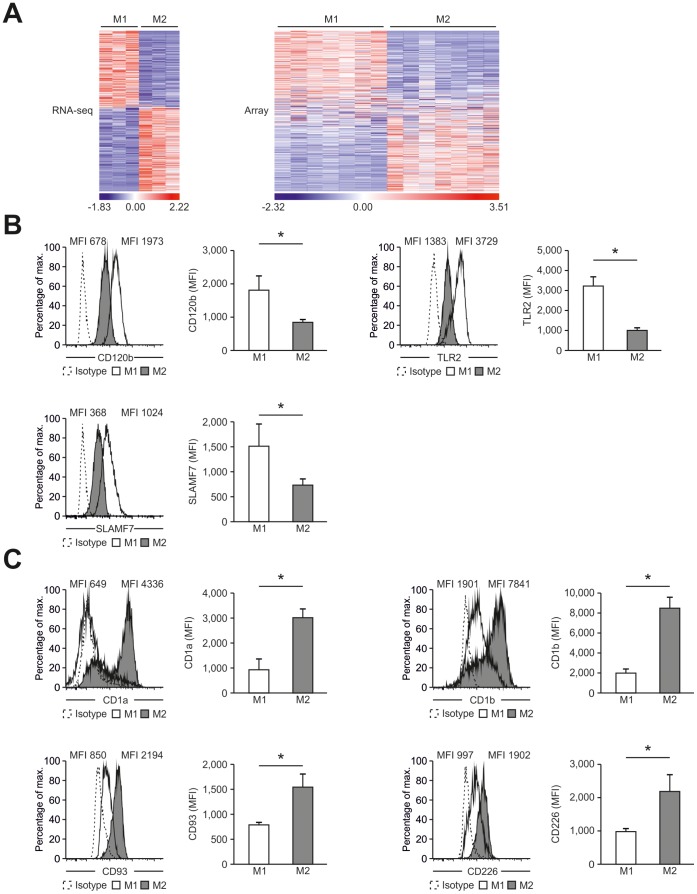
Figure 7. Identification of new macrophage polarization markers based on combined transcriptome analysis.
(A) Differentially expressed genes between M1- and M2-like macrophages of the human surfaceome were visualized as heatmaps for RNA-seq (left) and microarray analysis (right). Data were z-score normalized. (B–C) Expression of novel macrophage markers was determined by flow cytometry (left) of M1- and M2-like macrophages generated in the presence of GM-CSF with quantification shown in the graph at the right. Expression of (B) CD120b, TLR2, and SLAM7 as well as (C) CD1a, CD1b, CD93, and CD226. Isotype controls are depicted as dotted lines. *P<0.05 (Student’s t-test). Numbers in plots indicate mean fluorescence intensity. Data are representative of nine independent experiments (B,C; mean and s.e.m.) each with cells derived from a different donor.

