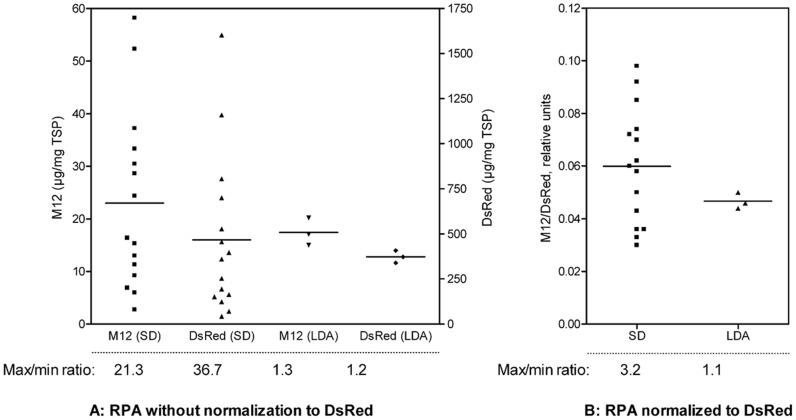
Figure 3. Comparison between leaf disc assay and the utilization of an internal marker.
Randomly selected leaf discs from an eight-week-old N. tabacum plant were infiltrated with A. tumefaciens carrying a plasmid containing the expression cassettes for M12 (target protein) and DsRed (internal marker) on the same T-DNA. After incubation (5 d, 25°C, 16/8 h light/dark cycle, 7 klux), the TSP was extracted from 15 single leaf discs (SD) and from three sets of nine pooled leaf discs according to the leaf disc assay protocol (LDA). The M12 accumulation was determined via ELISA, and the DsRed concentration was determined by measuring the fluorescence. All values were related to the TSP determined via the Bradford assay and are represented by dots that vary around the average rpa level (Figure 3A). The max/min ratio between each individual leaf disc and the pooled discs are shown below the graph. The M12 accumulation normalized to the DsRed accumulation from the same leaf disc or pool of leaf discs are shown in Figure 3B.

