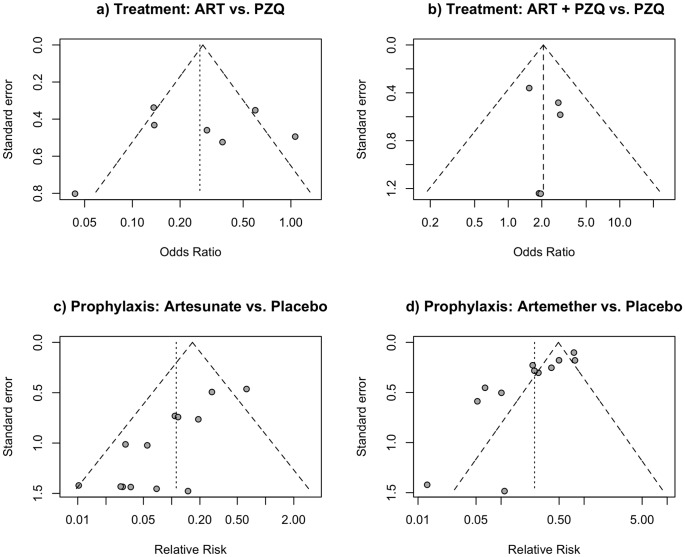
Figure 7. Funnel plots of differents subunits of analysis representing effect size against standard error.
A vertical line indicates the estimate summary effect based on each particular model. A pseudo confidence interval region is drawn around this value with bounds equal to ±1.96 · SE, where SE is the standard error value from the vertical axis.

