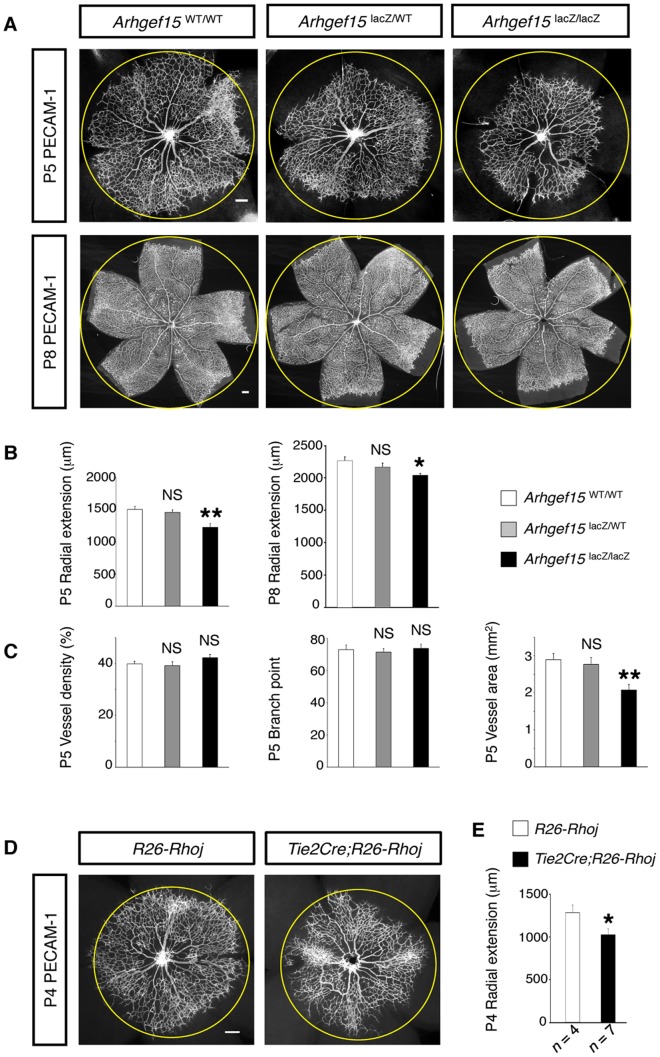
Figure 5. Retardation of retinal vascular growth in Arhgef15-KO mouse.
(A) Whole-mount IHC for PECAM-1 in P5 and P8 retinas. Circles represent the vascular margin of the Arhgef15WT/WT retinas. (B) Quantification of the radius of the retinal vascular networks (P5, n = 6; P8, n = 4). (C) Morphometric analyses of vascular networks in P5 retinas (n = 6 per group). (D) Whole-mount IHC for PECAM-1 in P4 retinas. Circles represent the vascular margin of the R26-Rhoj retina. (E) Quantification of the radius of the retinal vascular networks at P4. Scale bar: 200 µm. Error bars represent SEM; *P<0.05, **P<0.01.

