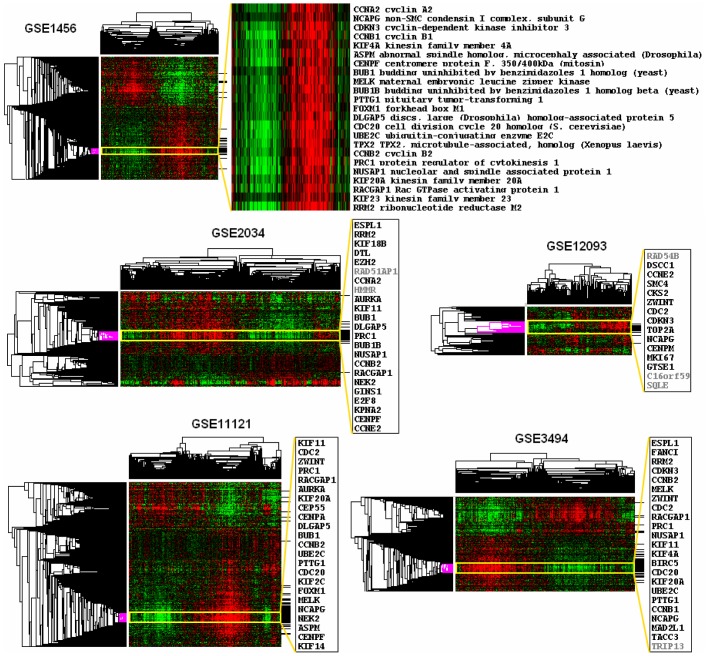
Figure 2. Identification of a common poor prognostic gene expression signature in breast cancer.
Top, cluster heatmap of gene expression using SCoR generated prognostic genes from GSE1456 dataset with a blowup of genes inside the center of the poor prognosis gene cluster (yellow box), genes matching top overlap genes from Table 1 were marked in black lines on the right side of the heatmap. Bottom panels, similar to top but only show the gene symbols from the center cluster. All genes involved in cell division cycle regulation are in black, otherwise are in grey.

