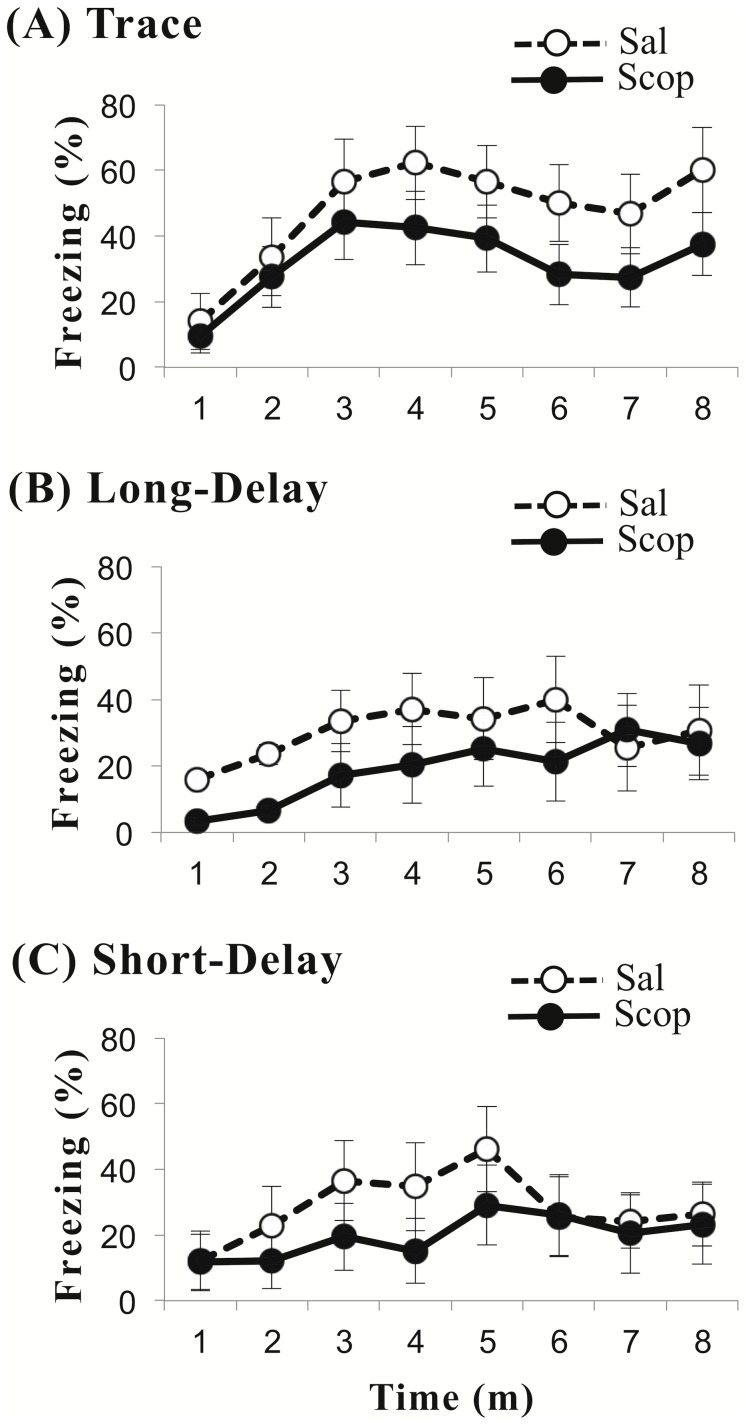
Figure 4. Results of context test.
The time series show freezing, expressed as a percentage of total time (± SE), during the 8-min context test. Open circles are from the control group (Sal) that received a saline infusion. Closed circles are from the experimental group (Scop) that received a scopolamine infusion. Parts A, B, and C, respectively, are plots from the trace, long-delay, and short-delay conditioned animals. There were no statistically-significant differences between saline-infused and scopolamine-infused animals.

