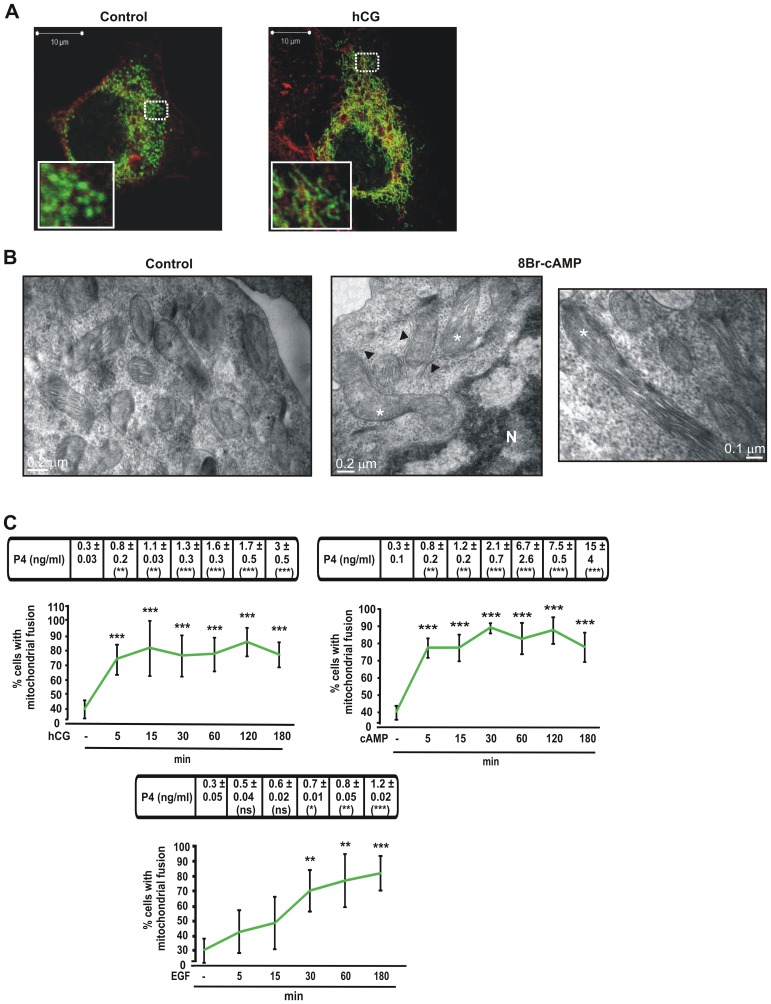
Figure 1. Hormonal stimulation causes an increase in fused mitochondria morphology in MA-10 cells.
A. Representative confocal images of the MA-10 cell line transfected with mtYFP (mito, Green). After 24 h transfection, cells were stimulated with or without hCG (20 ng/ml) for 1 h. Cell morphology was visualized by actin red staining with the fluorescence dye Phalloidin–TRITC (1∶2000), incubated for 1 h at room temperature. Scale bar, 10 µm. B. Representative Electron micrographs of mitochondria in MA-10 cells. Cells were stimulated with or without 8Br-cAMP (1 mM) for 1 h. Scale bars, 0.2 µm. Higher magnification of another section is shown for 8Br-cAMP-treated cells (left panel). Scale bar; 0.1 µm. Asterisks indicate tubular, elongated mitochondria. Arrowheads indicate ER. C. After 24 h transfection with mt-YFP, MA-10 cells were treated with or without hCG (20 ng/ml), 8Br-cAMP (1 mM) or EGF (10 ng/ml), for the indicated times. Cells were processed as described in materials and methods and observed with a fluorescence microscope. Cells with the indicated mitochondrial morphology shown in right image of panel A, named as mitochondrial fusion in the graphics, were quantified. More than a hundred cells were counted manually in at least four distinct optical fields. Quantitative analysis of fused mitochondria is shown. Results are expressed as the means ± SEM of three independent experiments. ***P<0.001 vs. control. **P<0.01 vs. control. Cellular medium was used to determine P4 production by RIA. Results of P4 measurement are indicated at the top of each graph as the means ± SEM of three independent experiments. ns P>0.05 vs. control. ***P<0.001 vs. control. **P<0.01 vs. control.

