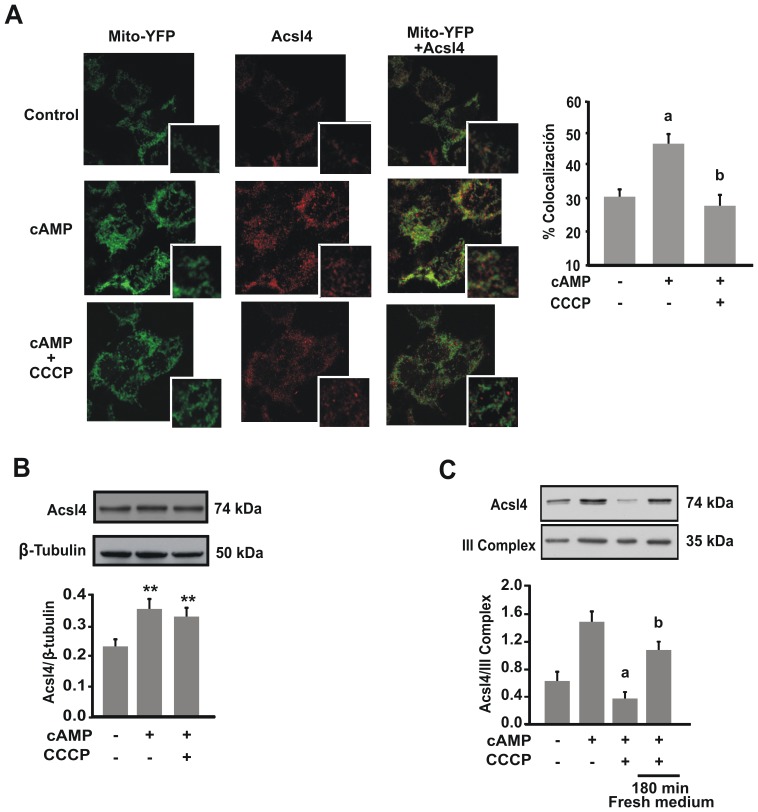
Figure 4. Hormonal stimulation allows an association between mitochondria and the MAM. A.
After 24 hour transfection with mt-YFP (green), MA-10 cells were treated with or without CCCP (5 µM) and 8Br-cAMP (1 mM) for 1 h. Representative immunofluorescence to confocal section of co-localization between mitochondria and the MAM (Left panel). The MAM was stained with Acsl4 polyclonal antibody (red) followed by secondary antibody conjugated with Cy3 fluorofore as described in materials and methods. Signal overlap was quantified using MBF-Image J (Right panel). Pearsońs colocalization coefficients were calculated from three independent experiments and then converted to percentages. Data represent means ± SEM. a P<0.001 vs. control and b P<0.001 vs. 8Br-cAMP. B. MA-10 cells were treated with or without CCCP (5 µM) and 8Br-cAMP (1 mM) for 1 h. Total proteins were obtained and western blotting was performed. An image of a representative western blot is shown. Membranes were sequentially blotted with anti-Acsl4 and anti-β-tubulin antibodies. For each band, the optical density (OD) of the expression levels of Acsl4 protein was quantified and normalized to the corresponding β-tubulin protein. The relative levels of Acsl4 protein are shown. Data are presented as an average SEM of three independent experiments. **P<0.01 vs. control. C. MA-10 Cells were treated with or without CCCP (5 µM) and 8Br-cAMP (1 mM) for 1 h, or incubation with CCCP and 8Br-cAMP for 1 h followed by washout and 3 h recovery. Mitochondria were isolated and western blotting was performed. An image of a representative western blot is shown. Membranes were sequentially blotted with anti-Acsl4 and anti-OxPhos complex III core 2 subunit (III Complex) antibodies. For each band, the OD of the expression levels of Acsl4 protein was quantified and normalized to the corresponding III Complex protein. The relative levels of Acsl4 protein are shown. Data are presented as an average SEM of three independent experiments. a P<0.001 vs. 8Br-cAMP and b P<0.001 vs. control.

