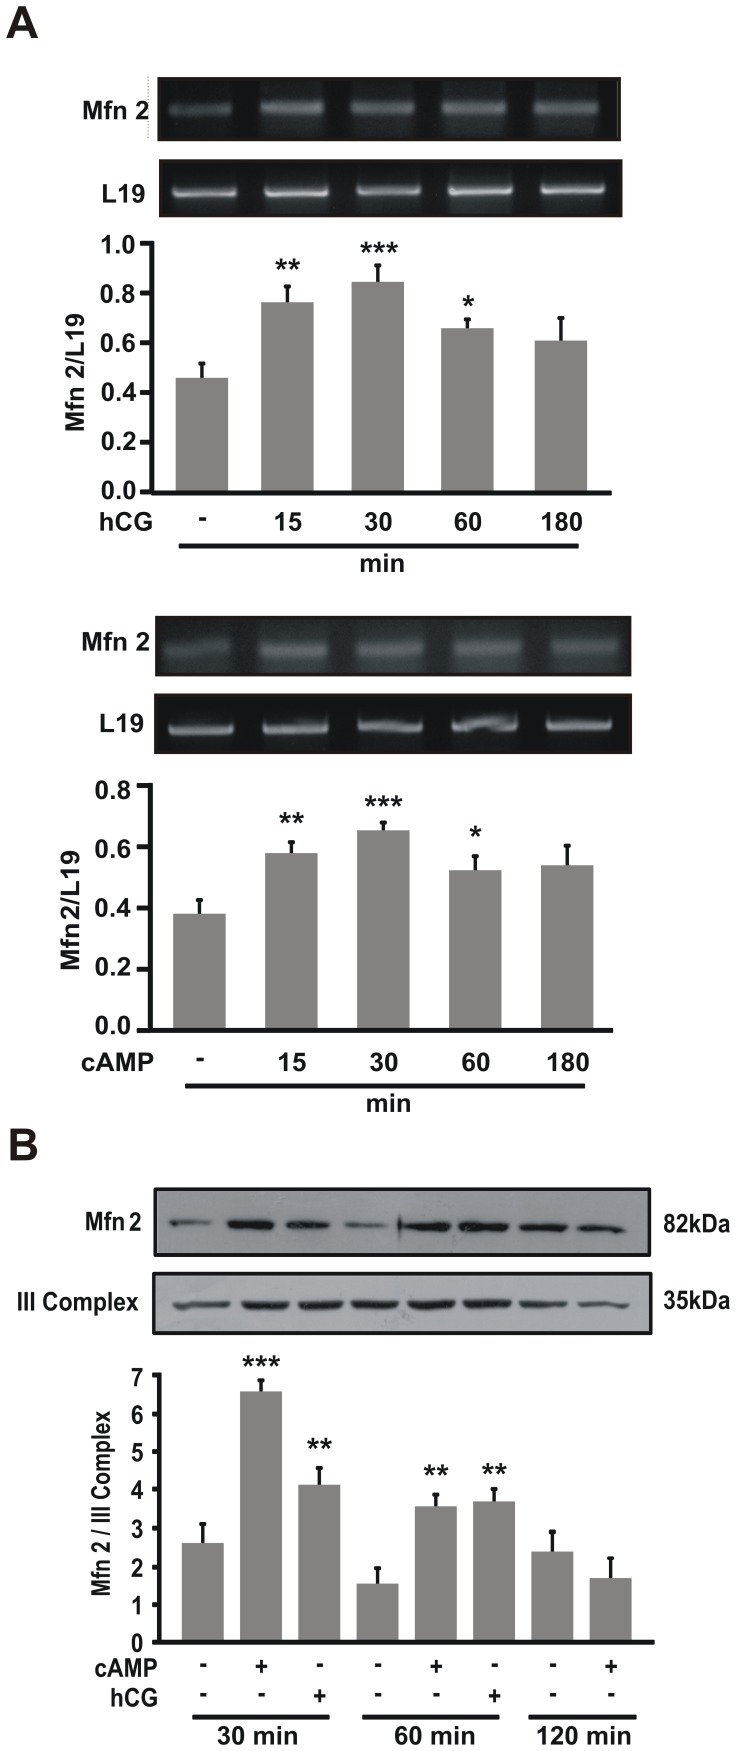
Figure 8. Hormonal stimulation induces Mfn2 expression.
MA-10 cells were treated with or without hCG (20 ng/ml) or 8Br-cAMP (1 mM) for the indicated times. A. Total RNA was isolated; reverse-transcribed, and subjected to semi-quantitative PCR using specific primers for Mfn2 and L19 cDNA as loading controls. PCR products were resolved in ethidium bromide-stained agarose gels. The figure shows representative gels. For each band, the OD of the expression levels of Mfn2 was quantified and normalized to the corresponding L19 abundance. The relative levels of Mfn2 are shown. The results are expressed as the means ± SEM of three independent experiments. **P<0.01 vs. control, ***P<0.001 vs. control, *P<0.05 vs. control. B. Mitochondria were isolated and western blotting was performed. An image of a representative western blot is shown. Membranes were sequentially blotted with anti-Mfn2 and III Complex antibodies. For each band, the OD of the expression levels of Mfn2 protein was quantified and normalized to the corresponding III Complex protein. The relative levels of Mfn2 protein are shown. The results are expressed as the means ± SEM of three independent experiments. ***P<0.001 vs. control. **P<0.01 vs. control.

