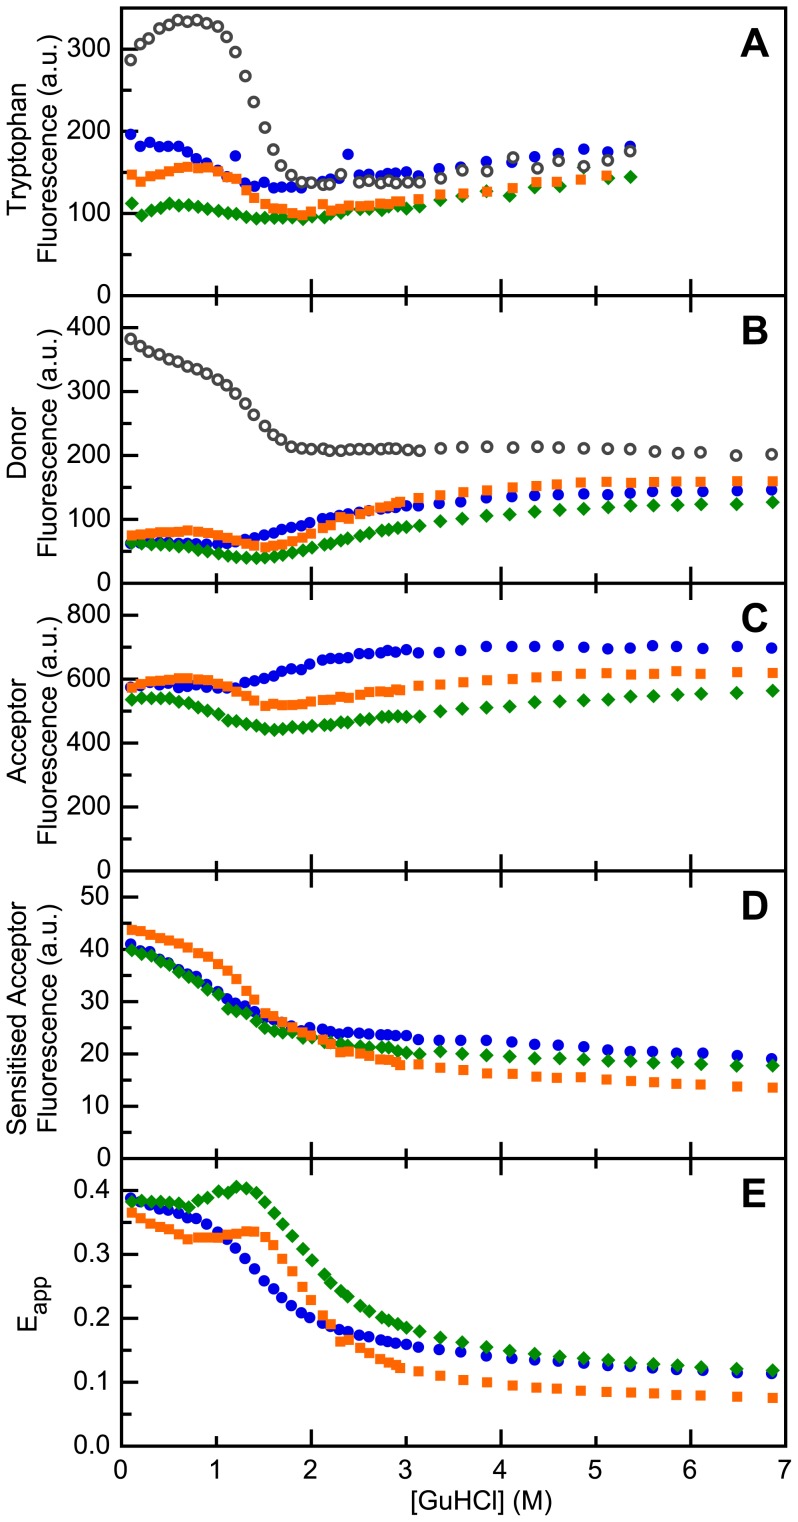
Figure 3. The denaturant-dependence of fluorescence signals of doubly dye-labeled apoflavodoxin reveals properties of apoflavodoxin’s folding intermediate.
Shown are fluorescence data of ‘donor-only’ protein (open circles), d69-a1 (blue circles), d69-a131 (green diamonds) and of d69-a178 (orange squares). Protein concentration is 62.5 nM. (a) Fluorescence emission intensity of tryptophan at 330 nm with excitation at 280 nm. (b) Fluorescence emission intensity of donor (A488) at 515 nm with excitation at 450 nm. (c) Fluorescence emission intensity of acceptor (A568) at 630 nm with excitation at 580 nm. (d) Sensitized fluorescence emission intensity of acceptor at 630 nm with excitation at 450 nm. (e) Apparent FRET efficiency (Eapp), calculated by using data of panels (b) and (d) and equation 3. Standard deviations of the fluorescence signals shown vary between 1 to 3% of the measured signal intensities.

