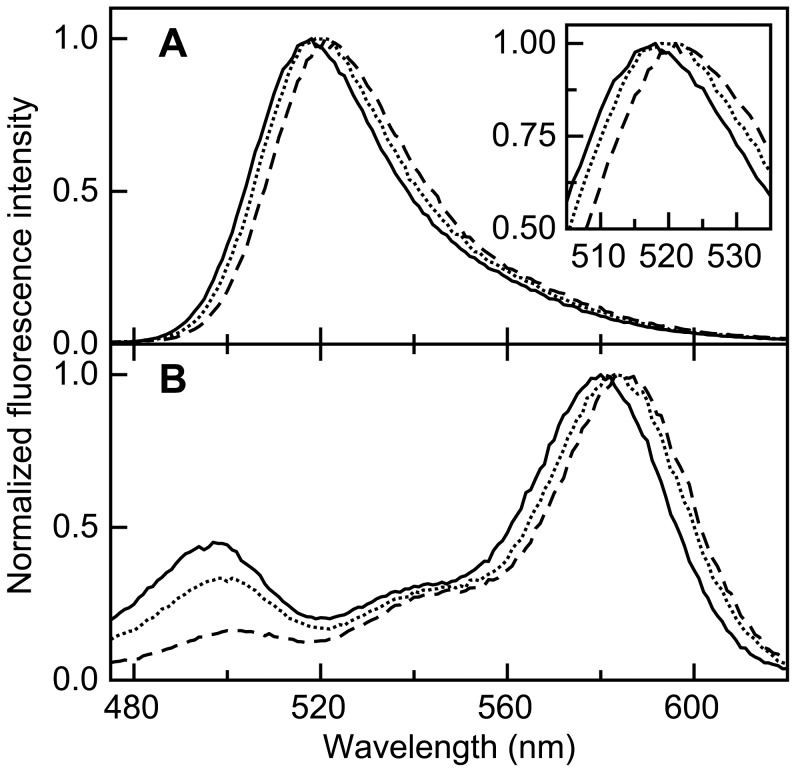
Figure 5. Upon adding denaturant, apoflavodoxin’s donor emission spectrum and acceptor excitation spectrum shift to the red.
(a) Normalized emission spectra of ‘donor-only’ apoflavodoxin. The inset zooms in on the fluorescence emission maximum, which shifts from 518 to 521 nm upon adding 6.9 M GuHCl. (b) Normalized excitation spectrum of acceptor of d69-a178. GuHCl concentrations are 0.1 M (solid line), 1.7 M (dotted line) and 6.9 M (dashed line), respectively.

