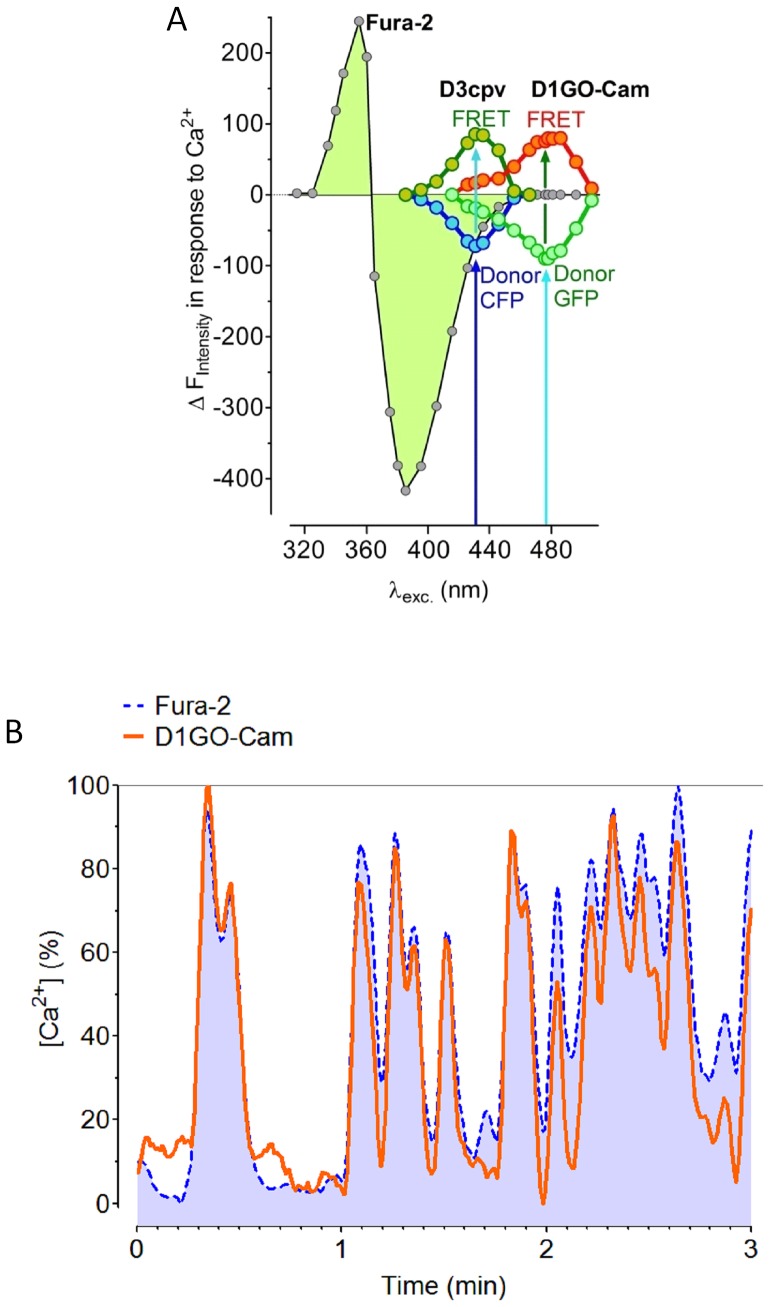
Figure 2. Determination of spectral overlaps between fura-2 and cameleons.
(A) Spectral overlaps between fura-2 and cameleons are demonstrated by plotting the Ca2+ induced changes of the fluorescence intensities at different excitation wavelength ranging from 315 nm –525 nm. Spectral scans were performed with Ea.hy926 cells on a digital wide field fluorescence microscope with an exposure time of 100 ms at each wavelength. Cells were either loaded with fura-2 or transiently transfected with D3cpv or D1GO-Cam. Emissions from the individual excitation wavelengths were taken at 480 nm (CFP of D3cpv), 510 nm (Fura-2 or GFP from D1GO-Cam), 535 nm (FRET of D3cpv), and 560 nm (FRET of D1GO-Cam), respectively. During the scans cells were stimulated with 10 µM ionomycin in the presence of 2 mM Ca2+ to induce strong changes of the fluorescence of the Ca2+ sensitive probes. (B) Representative glucose-induced oscillations of cytosolic Ca2+ within same individual INS-1 cells measured simultaneously with fura-2 (dotted blue line) and D1GO-Cam (continuous orange line). Curves are presented in percentage of the respective maximal delta ratio value of the fura-2 signal or the D1GO-Cam signal, respectively.

