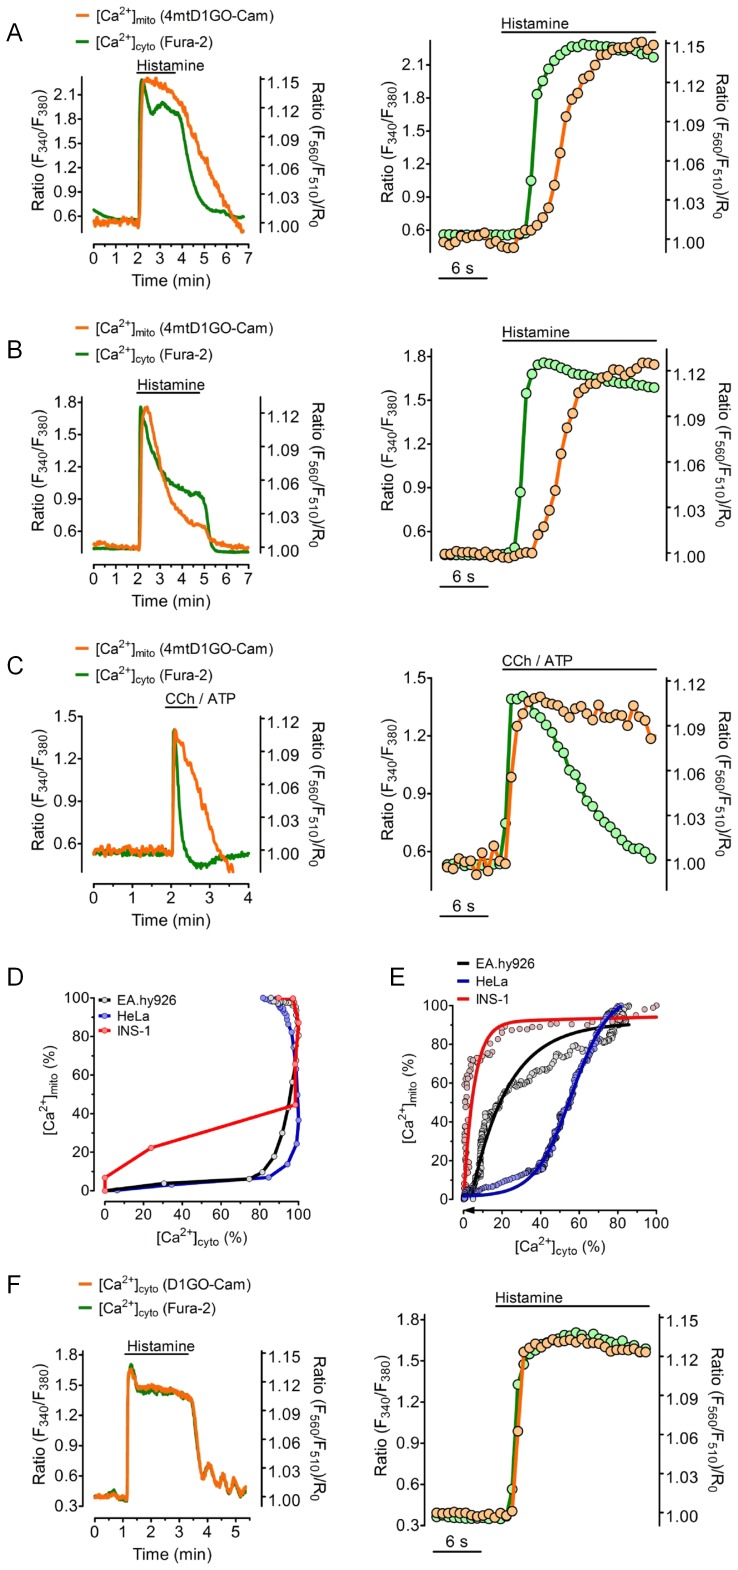
Figure 4. Comparison of cell type specific coupling between [Ca2+]cyto and [Ca2+]mito.
(A–E) Fura-2/AM loaded cells expression 4mtD1GO-Cam were used to simultaneously record [Ca2+]cyto (green traces) and [Ca2+]mito (orange traces) in response to cell stimulation with IP3-generating agonists. Respective zooms into the rising events are presented on right panels. (A) Representative traces of cytosolic and mitochondrial Ca2+ signals in Ea.hy926 in response to 100 µM histamine in the presence of 2 mM Ca2+. (B) Temporal correlation between [Ca2+]cyto and [Ca2+]mito in HeLa cells in response to 100 µM histamine in the presence of 2 mM Ca2+. (C) INS-1 cells were treated with a mixture of 100 µM CCh and 100 µM ATP in the absence of Ca2+. (D) [Ca2+]cyto and [Ca2+]mito in percentage of the respective maximal increases in response to the treatments shown in panels A-C are plotted against each other. Curves are representative for at least 4 independent experiments. (E) [Ca2+]cyto and [Ca2+]mito are plotted against each other for the Ca2+ extrusion phases during and after the removal of the IP3-generating agonists as indicated in panels A-C. (F) Representative time course of changes of [Ca2+]cyto in EA.hy926 cells in response to 100 µM histamine in the presence of 2 mM Ca2+ simultaneously measured with fura-2 and D1GO-Cam. The right panel shows the zoom into the rising event upon cell treatment with histamine.

