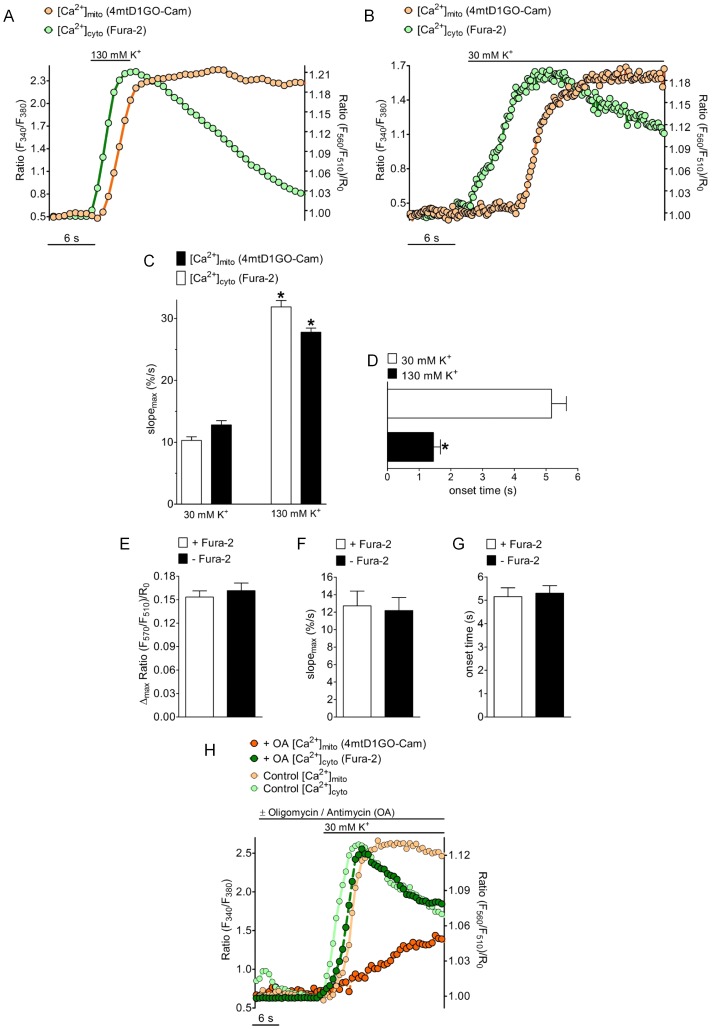
Figure 5. Temporal correlations of [Ca2+]cyto and [Ca2+]mito in INS-1 cells in response to Ca2+ entry via voltage gated Ca2+ channels.
(A) [Ca2+]cyto and [Ca2+]mito was simultaneously measured in fura-2 loaded INS-1 cells expressing 4mtD1GO-Cam upon cell depolarization with 130 mM K+ in the presence of 2 mM Ca2+. Rate of data acquisition was 709 ms. (B) INS-1 cells were depolarized with 30 mM K+ in the presence of 2 mM Ca2+. Sampling rate was 189 ms. (C) Maximal slopes of [Ca2+]cyto (white bars) and [Ca2+]mito (black bars) in response to 30 mM K+ (right columns, n = 32) and 130 mM K+ (left columns, n = 21) were calculated from respective percentage curves. The average maximal effects of respective Ca2+ signals induced by cell depolarization with either 30 mM or 130 mM were each defined as 100%. *P<0.05 vs. 30 mM K+. (D) Statistics of lag times between cytosolic Ca2+ rises and mitochondrial Ca2+ onsets if cells were stimulated with 30 mM K+ (white column, n = 32) and 130 mM K+ (black columns, n = 21). *P<0.05 vs. 30 mM K+. (E-G) Evaluation of the impact of fura-2 on mitochondrial Ca2+ signals measured with 4mtD1GO-Cam upon cell treatment with 30 mM K+. Columns represent the average of maximal delta ratios (E), maximum slopes (F), or the lag times between cytosolic Ca2+ rises and mitochondrial Ca2+ onsets (G) of ratio signals from 4mtD1GO-Cam in cells loaded with fura-2/AM (white columns, n = 14) or in the absence of fura-2 (black columns, n = 13). (H) Time course of simultaneously measured [Ca2+]cyto and [Ca2+]mito in individual single INS-1 cells stimulated with 30 mM K+ in the presence (dark curves) or absence (light curves) of 2 µM oligomycin and 10 µM antimycin A. Curves are representative for at least 4 independent experiments.

