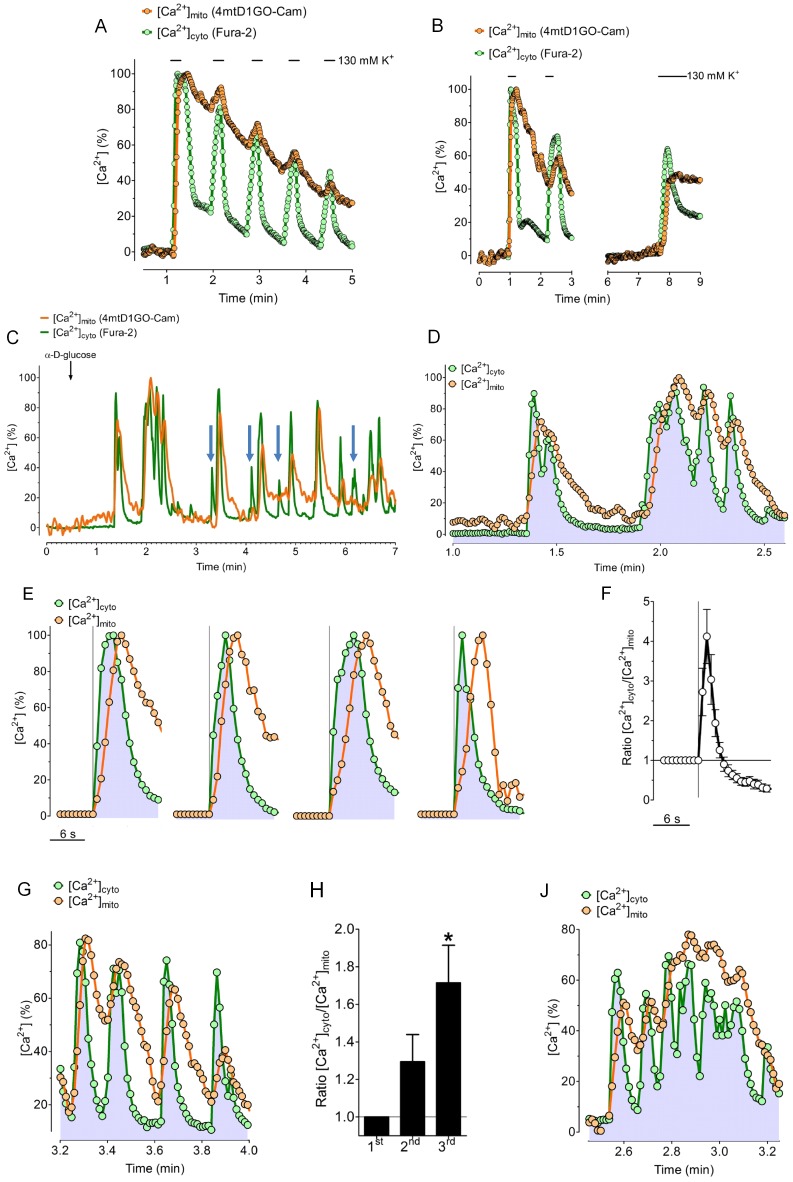
Figure 6. Correlation of repetitive cytosolic and mitochondrial Ca2+ transients and glucose-induced Ca2+ oscillations in INS-1 cells.
(A) Fura-2/AM loaded INS-1 cells expressing 4mtD1GO-Cam were repetitively stimulated with short pulses of 130 mM K+. The time course of both, [Ca2+]cyto (green trace) and [Ca2+]mito (orange trace) is plotted as representative curves. (B) Representative curves demonstrating [Ca2+]cyto and [Ca2+]mito of single individual INS-1 cells that were 3 times treated with pulses of high K+, with a longer recovery time between the second and third addition of 130 mM K+. (C) Temporal correlation between [Ca2+]cyto and [Ca2+]mito of glucose (16 mM) induced Ca2+ oscillations in a single individual INS-1 cell. [Ca2+]cyto and [Ca2+]mito were measured simultaneously using fura-2/AM loaded cells expressing 4mtD1GO-Cam. Blue arrows between minute 3 and 7 indicate clear cytosolic Ca2+ signals that were not transferred into mitochondria. (D) Zoom into a typical set of glucose induced Ca2+ oscillations in INS-1 cells from the curves presented in panel C. (E) Temporal correlations between [Ca2+]cyto (green trace) and [Ca2+]mito (orange trace) of single isolated Ca2+ transients of INS-1 cells in response to 16 mM glucose from 3 independent experiments. (F) Statistical evaluation of the temporal correlation between [Ca2+]cyto and [Ca2+]mito of the single isolated Ca2+ transients shown in panel A by calculating the average ratio of [Ca2+]cyto/[Ca2+]mito (n = 8). (G) Representative traces of [Ca2+]cyto and [Ca2+]mito of fast subsequent cytosolic Ca2+ transients of INS-1 cells in response to 16 mM glucose. (H) Statistical evaluation of the temporal correlation between [Ca2+]cyto and [Ca2+]mito of fast subsequent Ca2+ transients by calculating the maximal ratios of [Ca2+]cyto/[Ca2+]mito of respective subsequent signals from 3 independent experiments (n = 3). (J) Representative traces of [Ca2+]cyto and [Ca2+]mito of complex glucose induced Ca2+ signal clusters in INS-1 cells.

