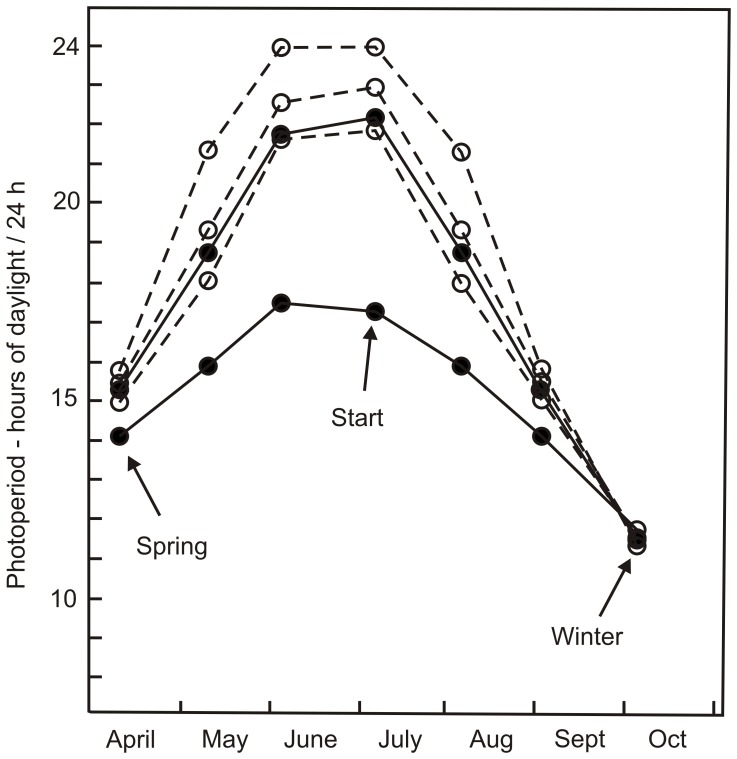
Figure 2. Progression of photoperiod (including half the Civil Twilights at sunrise and sunset) at five different latitudes between 52°N and 67°N.
Filled circles connected by solid lines represent the two photoperiod treatments used during the experiment (northern, 64°N, above and southern, 52°N, below). Open circles connected by dashed lines represent photoperiods at latitudes where study damselflies were sampled (67°N, 66°N, and 62°N from the highest to the lowest lines, respectively). Arrows indicate dates of the start of the experiment (“Start”), the initiation of winter conditions (“Winter”), and the initiation of spring conditions (“Spring”).

