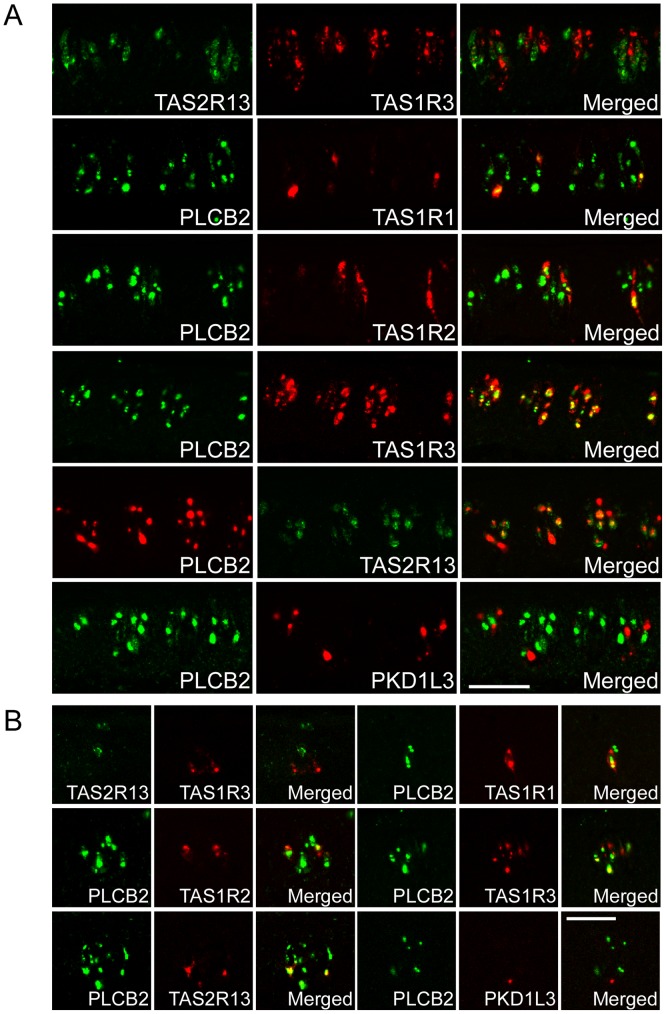
Figure 4. The co-expression relationships among taste receptors.
(A) In the CvP, the TAS1R3-positive TRCs were negative for TAS2R13. The PLCB2-positive TRCs, which include TAS1R1-, TAS1R2-, TAS1R3-, and TAS2R13-positive TRCs, were negative for PKD1L3. n = 1 (numbers of sections ≥2). (B) In the FuP, the TAS1R3-positive TRCs were negative for TAS2R13. The PLCB2-positive TRCs, which include TAS1R1-, TAS1R2-, TAS1R3-, and TAS2R13-positive TRCs, were negative for PKD1L3. n = 1 or 2 (numbers of sections ≥10). Scale bars: 50 µm.

