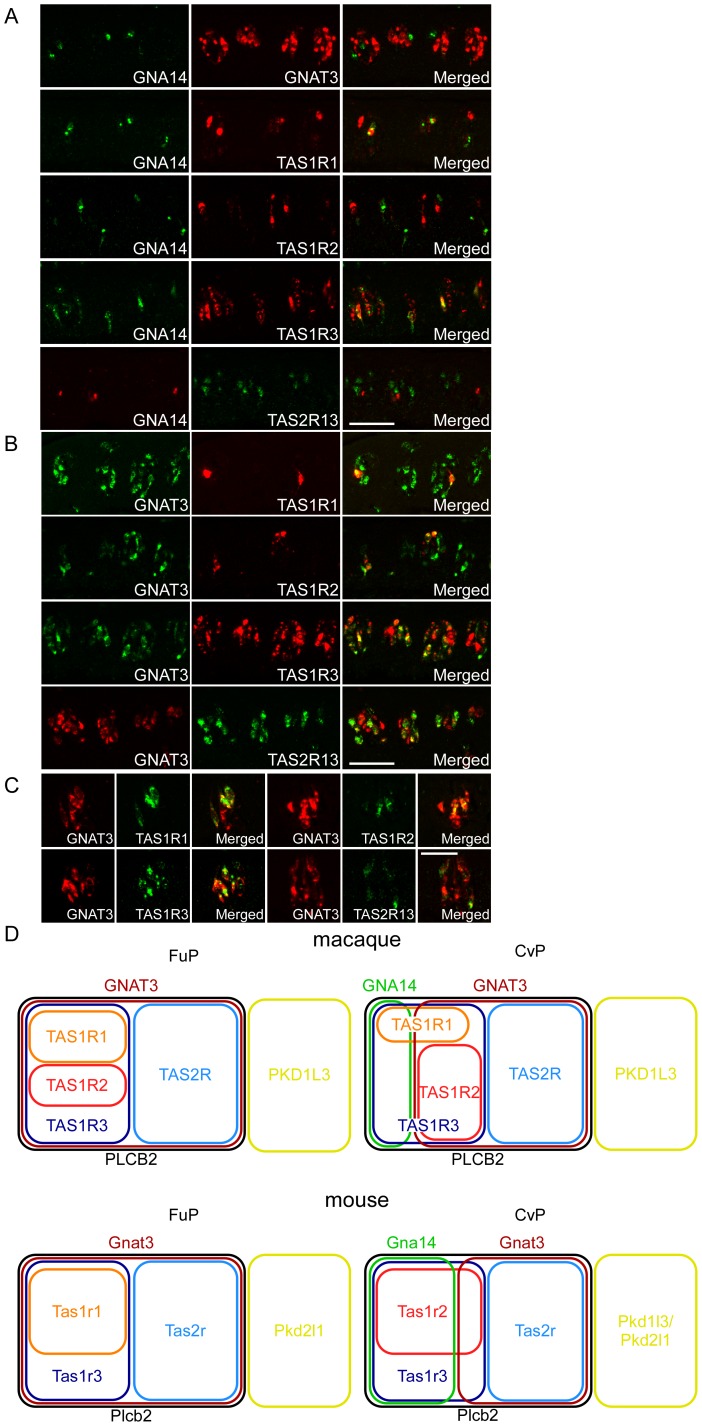
Figure 5. The co-expression relationships among taste receptors and G protein α subunits.
(A) In the CvP, GNA14 was expressed in a much smaller population of TRCs than GNAT3 and in a mutually exclusive manner. The GNA14–positive TRCs were distinct from those expressing TAS1R2 and TAS2R13, but they were subsets of the TAS1R3-positive TRCs and partially overlapped with the TAS1R1-positive TRCs. n ≥1 (numbers of sections ≥2). (B) In the CvP, TAS1R2 and TAS2R13 were expressed in subsets of the GNAT3–positive TRCs, which partially overlapped with the TAS1R1- and TAS1R3-positive TRCs. n ≥2 (numbers of sections ≥4). (C) In the FuP, TAS1R1, TAS1R2, TAS1R3, and TAS2R13 were expressed in subsets of GNAT3-positive TRCs. n ≥1 (numbers of sections ≥10). (D) Venn diagram illustrating the co-expression relationships among taste receptors and signal transduction molecules in the macaque and the mouse. Scale bars: 50 µm.

