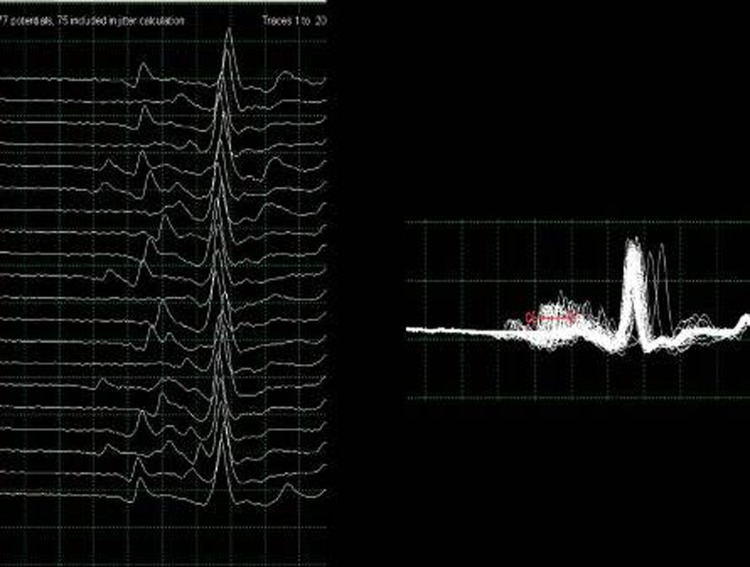
Figure 1.
Stimulation single fibre electromyography (Stim SFEMG) study of right orbicularis oculi. The figure on the left shows a faster display of single fibre muscle action potentials and the right shows the superimposed display. The highlighted units (big white arrows) have an increased jitter measurement with mean consecutive difference (MCD) of 145 and 45 µs. The potential on the left is also blocking.

