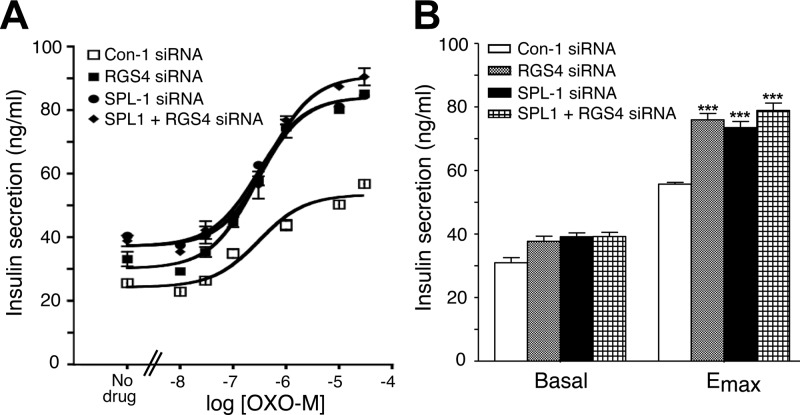
Figure 5.
Effect of single and combined knockdown of RGS4 and SPL expression in MIN6 cells on M3R-mediated insulin release. A) Representative concentration-response curves for OXO-M-induced increases in insulin secretion. MIN6 cells were electroporated with RGS4 and SPL-1 siRNAs, either individually or in combination (Con-1=scrambled control siRNA). Cells were incubated with increasing concentrations of OXO-M in the presence of 16.7 mM glucose. B) Summary of basal and maximum insulin release (Emax) derived from OXO-M concentration-response curves. Data are expressed as means ± se of 5 independent experiments. ***P < 0.001 vs. Con-1 siRNA-treated cells.

