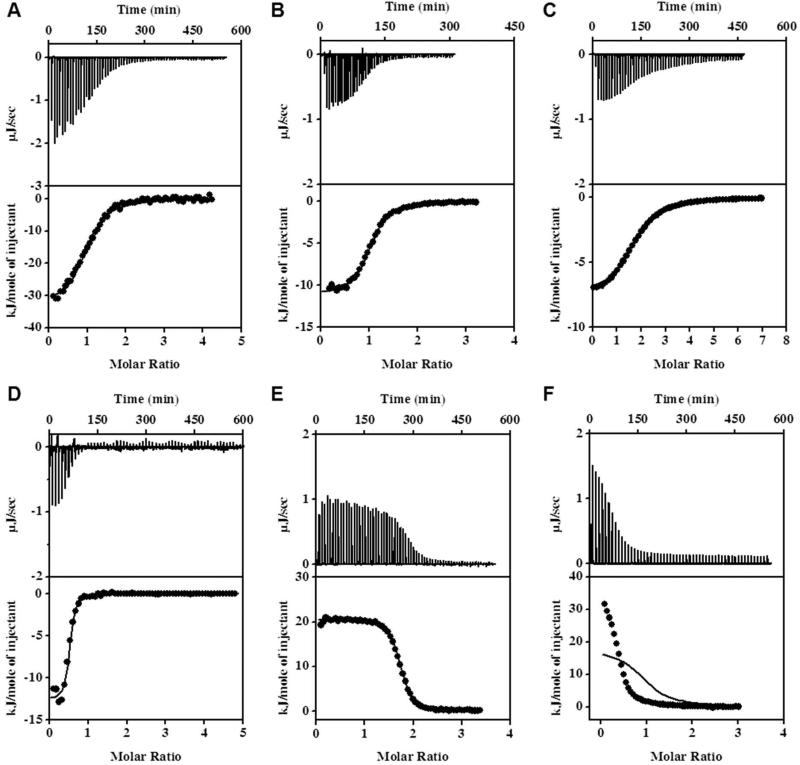
Figure 1.
Examples of ITC experiments showing the binding of p53, TRTK12, NDR, HDM2, and HDM4 peptides to S100B in the presence of calcium. Plots represent the raw heat effects (μJ/sec) as a function of time, the cumulative heat effects (kJ/mol, represented by closed circles) as a function of the molar ratio of peptide to protein, and the fits to the experimental data (solid lines) for: p53 binding to S100B at 25 °C (Panel A; data fitted to equation 2), TRTK12 binding to S100B at 25 °C (Panel B; data fitted to equation 2), NDR binding to S100B at 30 °C (Panel C; data fitted to equation 3), HDM2 binding to S100B at 35 °C (Panel D; data fitted to equation 2), HDM4 binding to S100B at 10 °C (Panel E; data fitted to equation 2), HDM2 binding to S100B at 15 °C (Panel E; data fitted to equation 1).

