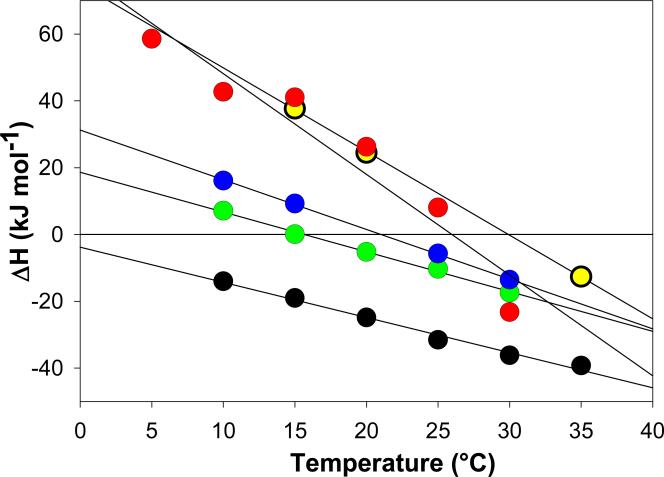
Figure 2.
Temperature dependence of the enthalpies, ΔHcal, of the TRTK12 (green circles), p53 (black circles), NDR (blue circles), HDM2 (yellow circles), and HDM4 (red circles) peptides binding to the S100B protein in the presence of 5 mM calcium. Solid lines represent linear fits of the ΔHcal temperature dependencies for each S100-peptide interaction. The slopes of these lines represent the experimental change in heat capacity, which are summarized in Table 1.

