
Figure 2.
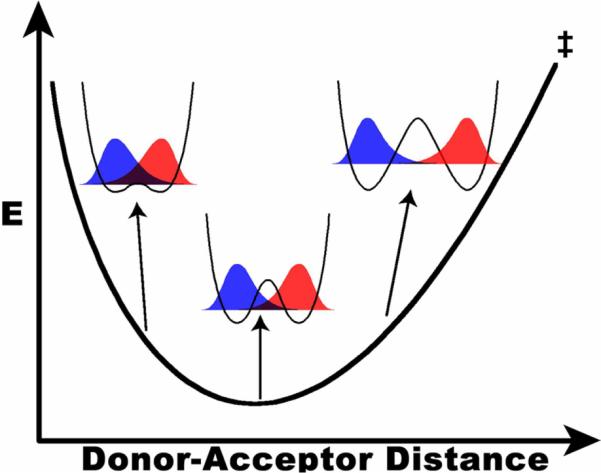
PES of the DAD coordinate along the seam where the reactant and product surfaces are degenerate (the TRS). Slices along the orthogonal tunneling coordinate are shown at three different DADs, demonstrating the change in overlap between reactant (blue) and product (red) wavefunctions. The wavefunction overlap at each distance is proportional to the tunneling probability at that distance and is isotopically sensitive. The present model uses the temperature dependence of KIEs to determine the population distribution of DADs, which is dictated by this PES.