
Figure 3.
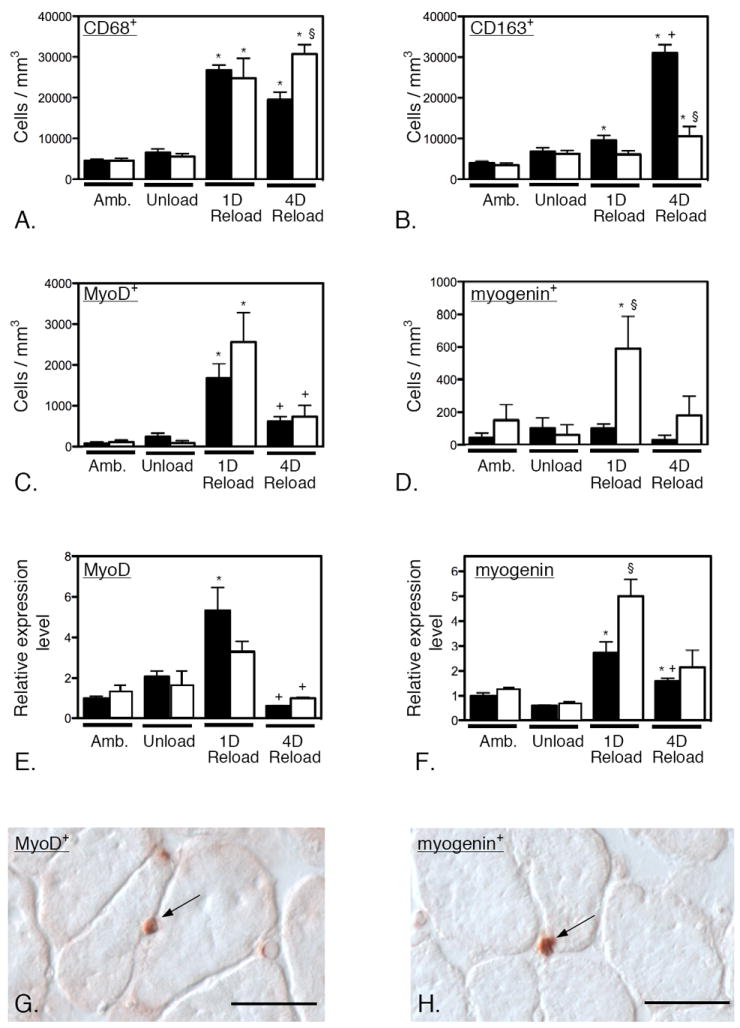
Null mutation of IL-10 amplifies CD68high macrophage numbers, reduces M2 macrophage numbers and perturbs myogenin expression in injured muscle. A – D: Cell counts of CD68+ (A), CD163+ (B), MyoD+ (C) and myogenin+ (D) cells in soleus muscles of wild-type and IL-10 null mutants over the time-course on muscle unloading and reloading. A. Numbers of CD68+ macrophages are elevated at 1-day of reloading in wild-type and mutant muscles and CD68+ cell numbers begin to decline after 1-day of muscle reloading of wild-type muscle. However, IL-10 null mutants do not experience a decline in CD68+ cells at 4-days of reloading. B. Numbers of CD163+ macrophages are elevated slightly in wild-type muscles at 1-day reloading, but not in mutant muscles at that time-point. Numbers of CD163+ cells are elevated in both wild-type and mutant muscles at 4-days reloading, but the numbers are greatly amplified in wild-type muscles. C. The numbers of MyoD-expressing satellite cells show similar increases in both wild-type and mutant muscles at 1-day of reloading and similar reductions in numbers at 4-days reloading. D. The numbers of myogenin-expressing satellite cells show large increases in mutant muscle at 1-day of reloading, although their numbers do not change significantly in wild-type muscles at that time-point. E and F. QPCR data showing changes in the levels of expression of MyoD (E) and myogenin (F) over the course of muscle unloading and reloading. The changes in gene expression for the two transcripts resemble the changes in numbers of MyoD+ and myogenin+ cells shown in Figures 3C and 3D. * indicates significantly different from ambulatory control muscle of same genotype at p < 0.05. § indicates significantly different from wild-type muscle under the same treatment conditions at p < 0.05. + indicates significantly different from 1-day reloaded muscle of same genotype at p < 0.05. Each bar represents the mean and sem for the muscles collected from 5 mice in each data set. All data in each set were normalized relative to expression levels in ambulatory, wild-type muscles which were set at 1.0. G. Image showing an anti-MyoD labeled satellite cell (arrow) at the surface of a muscle fiber in 1-day reloaded, IL-10 null muscle. H. Image showing an anti-myogenin labeled satellite cell (arrow) at the surface of a muscle fiber in 4-days reloaded, IL-10 null muscle. Bars = 40 μm.