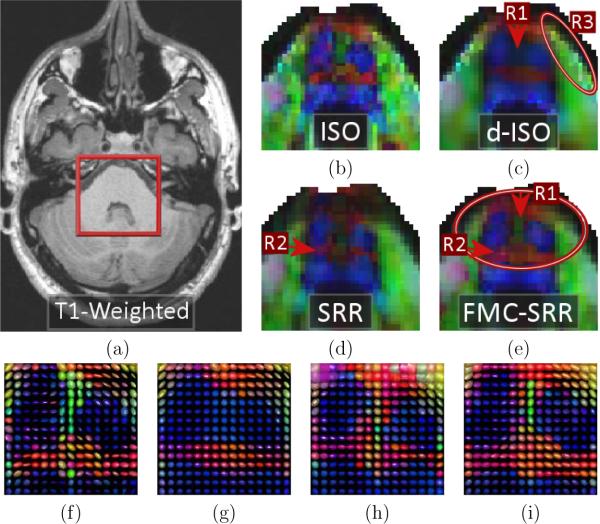
Figure 10.
Zoom on the color-FA maps in a region of the brain stem. (a): T1-weighted image showing the zoom location (axial view). Color-FA maps and estimated tensors for (b/f): ISO, (c/g): d-ISO, (d/h): SRR and (e/i): FMC-SRR. The color-FA for ISO is highly noisy, while the noise reduction technique employed in d-ISO makes the structures fuzzy (region R1) and produces artifacts (R3). In SRR some structures are missing due to the non-correction of distortion (R2). FMC-SRR provides the most detailed structures (R1).

