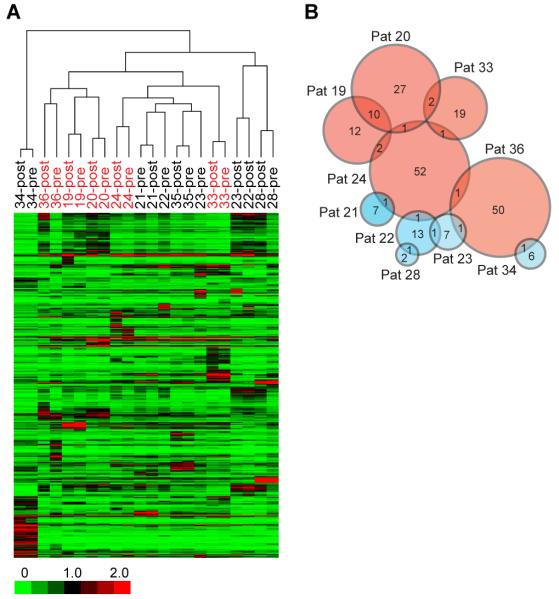
FIGURE 2. Profiling of antibody responses in cancer patients to CTLA-4 blockade and GM-CSF with protein microarrays.
(A) Unsupervised clustering of median centered log2 transformed and normalized fluorescence intensities in pre-treatment and post-treatment sera of 11 evaluable patients binding to proteins spotted on the arrays. Responders are highlighted in red and non-responders in black. (B) Venn diagram showing the number of up-modulated antibodies that are shared (shown by number in overlaps) or are unique in the 11 patients. Responders are represented by pink circles and non-responders in blue. Sizes of circles approximate the number of antigens.

