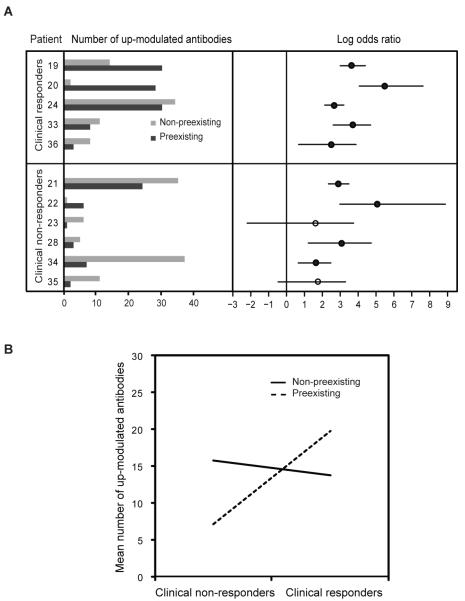
FIGURE 3. Association between up-modulated antibodies with preexisting or non-preexisting antibody responses.
Normal mixture modeling with estimation-maximization (EM) was used to define the boundary for determining the presence or absence of preexisting antibodies. (A) The left panel shows the number of two fold up-modulated antibodies in the post-treatment serum to antigens where there are no preexisting antibodies (light grey) and to antigens where there are preexisting antibodies (dark grey) in the pre-treatment serum for each patient. The right pane shows log odds ratios comparing two fold up modulation for preexisting versus non-preexisting antibody groups for each patient. Significant log odds ratio values are shown as solid circles (significance determined as Bonferroni adjusted p-value < 0.05 from performing 2-sided Fisher’s exact test for each patient). (B) Interaction plot using multiplicative poisson regression model with the number of antibodies up-modulated, clinical response status and pre-treatment preexisting or not status as dependent variables. Response main effect p-value: 2.6e-08; pre-treatment preexisting main effect p-value: 1.6e-05; and interaction p-value: 1.8e-06.

