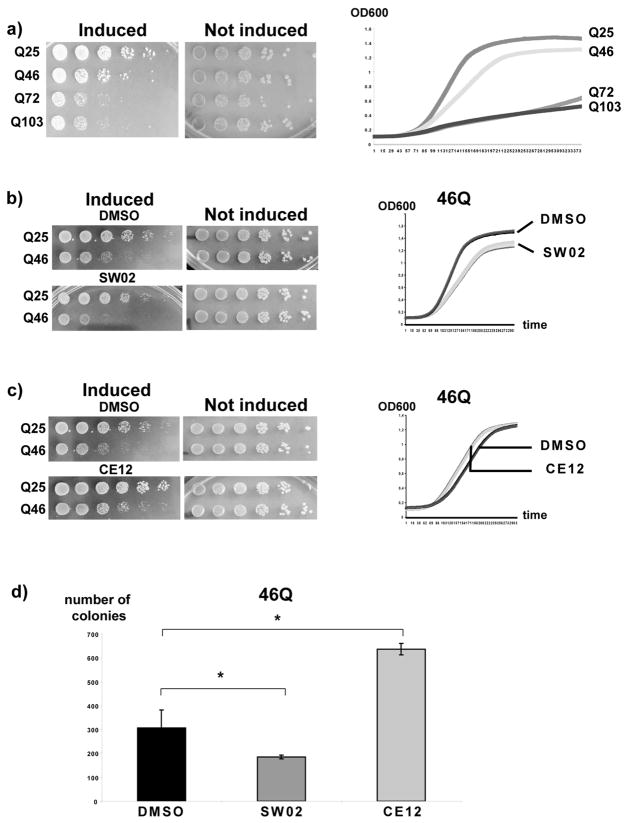
Figure 3. SW02 exacerbates and CE12 antagonizes polyQ toxicity.
a) Left panel: yeast cells expressing 25Q, 46Q, 72Q, or 103Q polyQ Htt were spotted in six fivefold dilutions (left to right) on plates containing galactose as sole carbon source for the induction of the expression of the polyQ Htt proteins (induced) or on plates with glucose as sole carbon source for the repression of the polyQ Htt proteins (not induced). Right panel: growth of liquid yeast cultures expressing 25Q, 46Q, 72Q, or 103Q polyQ Htt was monitored by BioscreenC. b) Left panel: yeast cells expressing 25Q or 46Q polyQ Htt were spotted in six fivefold dilutions (left to right) on plates containing galactose and DMSO or 100μM of SW02. Right panel: growth of liquid yeast cultures expressing 25Q or 46Q polyQ Htt in the presence of DMSO or 100μM of SW02 was monitored by BioscreenC. The growth curves for four different cultures for each condition are shown. c) Left panel: yeast cells expressing 25Q or 46Q polyQ Htt were spotted in six fivefold dilutions (left to right) on plates containing galactose and DMSO or 50μM of CE12. Right panel: growth of liquid yeast cultures expressing 25Q or 46Q polyQ Htt in the presence of DMSO or 50μM of CE12 was monitored by BioscreenC. The growth curves for four different cultures for each condition are shown. d) Yeast cells were plated on SD plates after 8 hour incubation in media containing galactose (for the induction of 46Q) and DMSO, 50μM Ce12, or 100μM SW02. The number of colony forming units was determined from three independent cultures. The error bars represent SEM. *p<0.05 (two-tailed T-test).

