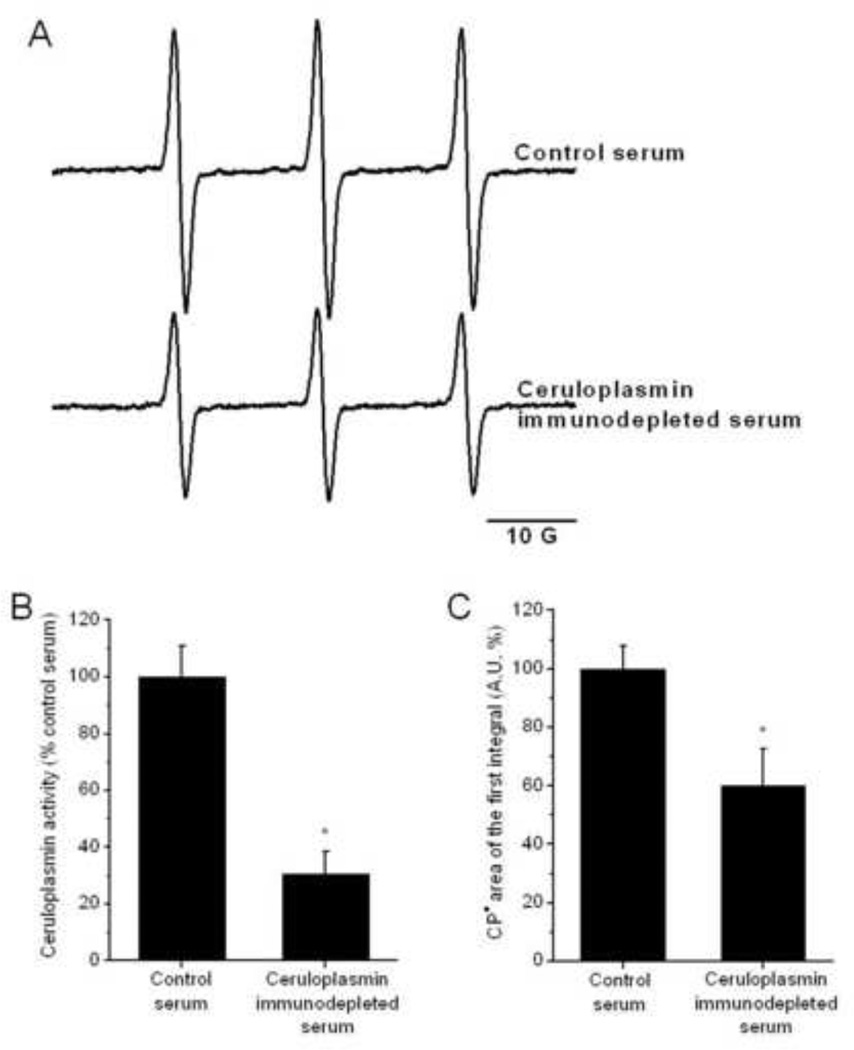
Figure 8.
CPH-nitroxide yield in samples prepared with ceruloplasmin-immunodepleted rat serum. Panel (A) shows the EPR-spectra of CPH-nitroxide signals detected in samples of control and ceruloplasmin-immunodepleted rat serum with 1 mM CPH. The spectra were recorded after incubation for 10 min at 25°C. The activity of ceruloplasmin (B) was determined in the control and immunodepleted rat serum samples. The calculated areas of the CPH-nitroxide signals are shown in (C). The data in panels (B) and (C) are expressed as percentage of the average control rat serum sample measured. Statistically significant differences are shown (* P < 0.05).

