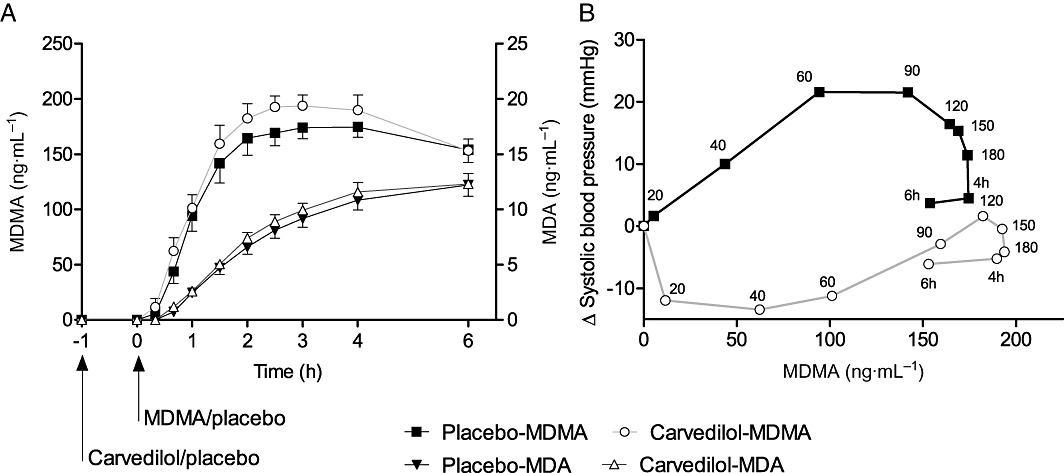
Figure 4.

Pharmacokinetics (A) and pharmacokinetic–pharmacodynamic relationship (B). Carvedilol non-significantly increased the exposure to MDMA and MDA (A). The values are expressed as mean ± SEM in 16 subjects. Carvedilol was administered at t =−1 h. MDMA was administered at t = 0 h. MDMA effects on systolic blood pressure plotted against MDMA plasma concentration (B). The values are expressed as means of the changes from baseline in 16 subjects. The time of sampling is noted next to each point in min or h after MDMA administration. Carvedilol produced a downward and rightward shift of the concentration-blood pressure response curve of MDMA (B).
