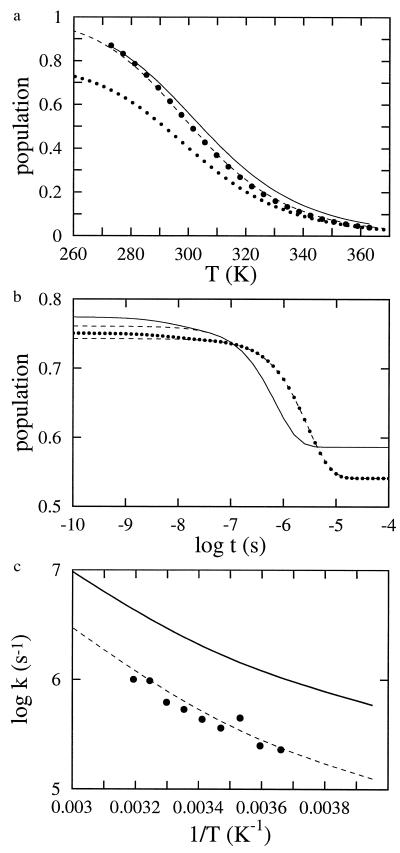
Figure 4.
Comparison of thermal unfolding curves and kinetics for modified single sequence and complete models. (a) Fractional population of the hydrophobic cluster as a function of temperature. Derived from a two-state analysis of fluorescence equilibrium curves (large dots). Fit to the data with the modified single sequence model (Eqs. 3 and 4), producing the parameters ΔSconf = −2.74 cal mol−1 K−1, ΔHhb = −0.96 kcal mol−1, ΔGsc = −1.94 kcal mol−1 (dashed line). Calculated with the complete model using these parameters (continuous line). Fraction of native hydrogen bonds calculated using the model with modified single sequence approximation (dotted line). (b) Simulations of progress curves for the complete model (continuous line) and the model using the modified single sequence approximation (dotted line). The fractional population of the hydrophobic cluster vs. time is plotted following a temperature jump from 283 to 298 K. The dashed lines are single exponential fits to the simulated progress curves at times >10 ns, the resolution of the T-jump instrument. The fits of the modified single sequence model to the kinetic data were performed using the lsoda routine (36), which incorporates algorithms for solving both stiff and nonstiff systems of equations. The resulting parameters were k0 = 8.0 × 10⁸ s−1 and E0 = 0 (equilibrium parameters same as in a. The equilibrium and kinetic parameters are slightly different from those reported by Muñoz et al. (27) for two reasons. One is that in the previous work the viscosity dependence was not included in the preexponential factor, and the second is that in the present work the kinetic and equilibrium data were fit simultaneously, whereas in the previous analysis (27), the equilibrium data were fit independently. (c) Arrhenius plot of relaxation times following 15 degree temperature jumps. The points are the experimental relaxation rates, whereas the dashed curve through the points is obtained from the fit to the data using the modified single sequence model. The continuous curve is obtained from single exponential fits to the kinetic progress curves generated by the complete 215-state model using the kinetic parameters from the modified single sequence model.

