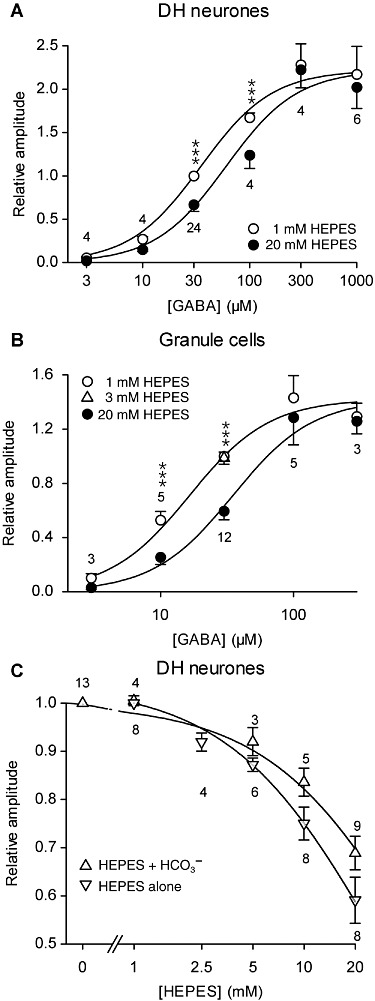
Figure 4.

In DH neurones and GCs, HEPES inhibited the currents induced by non-saturating GABA concentrations in a dose-dependent manner (constant pH 7.3). (A and B) Concentration-response curves of the maximal current amplitude induced by GABA in DH neurones (A) and GCs (B) in the presence of 1 mM or 20 mM HEPES (A) or 1mM, 3mM and 20mM HEPES (B). The maximal current was normalized to the current induced by 30 µM GABA in the presence of 1 mM HEPES. Solid lines correspond to a global curve fitting of the pooled data using equation (1). Parameter values were KGABA= 33.6 µM, KHEPES= 25.5 mM, Hill number n= 1.31 for DH neurones (A), and KGABA= 15.5 µM, KHEPES= 15.9 mM, n= 1.45 for GC neurones (B). ***P < 0.001, significantly different from values with 20 mM HEPES; Tukey test following repeated measures anova. (C) Concentration-response curves of the current amplitude induced by 30 µM GABA in DH neurones in the presence of various concentrations of HEPES, with and without HCO3-/CO2-buffering. Values with HCO3-/CO2-buffering are normalized to the amplitude of the current induced by 30 µM GABA in the absence of extracellular HEPES and values with HEPES as the only pHe buffer are normalized to the amplitude of the current induced by 30 µM GABA in the presence of 1 mM HEPES. Solid lines correspond to curve fitting with equation (2). Numbers on the graph correspond to the number of neurones recorded. Data represent the mean of normalized values ± SEM. All experiments were performed at the same pHe 7.3.
