
Figure 3.
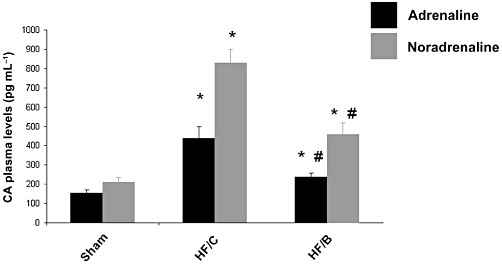
Plasma catecholamine (CA) levels in the three experimental groups at the end of the study. Data for noradrenaline and adrenaline are presented separately as means ± SEM. *P < 0.05 versus Sham or HF/B groups (n= 10 for each group); #P < 0.05 versus Sham or HF/C. anova analysis and Bonferroni test among all groups.