
Figure 4.
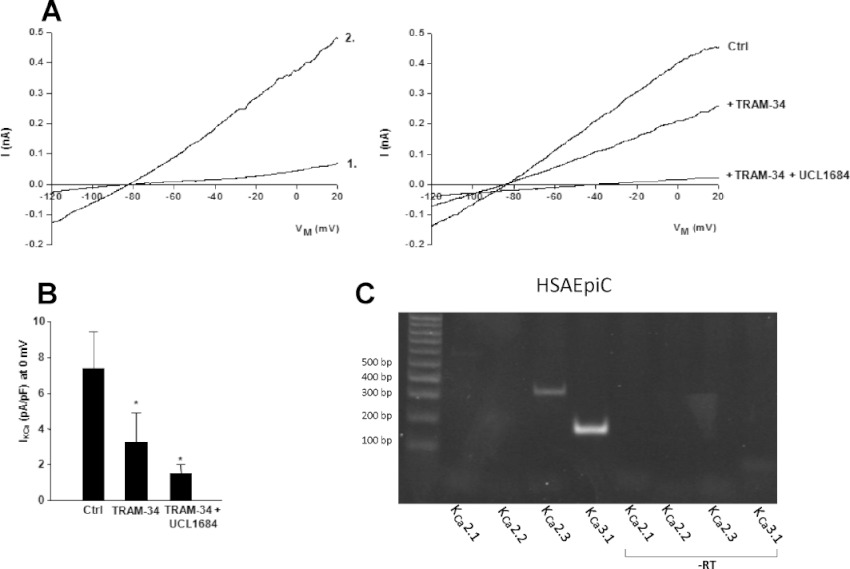
KCa3.1 and KCa2 currents in HSAEpi cells. (A) Upper panel on left illustrates base line currents (1), immediately after membrane rupture (to achieve electrical access) and current–voltage relationship of KCa currents (2; n= 6 experiments) activated during cell dialysis with a pipette solution containing 3 µM [Ca2+]free. To achieve maximal and stable channel activation, the KCa2/KCa3.1 channel opener SKA-31 (1 µM) was added to the bath solution. Upper panel on right: Currents were reduced by the KCa3.1 channel blocker TRAM-34 (1 µM, n= 4 experiments) and further reduced by additional application of the KCa2 channel blocker UCL1684 (1 µM, n= 4 experiments). (B) Summary data for K+-currents at 0 mV. Values are given as mean ± SEM; *P < 0.05, paired Student's t-test. (C) RT-PCR of KCa2 channels on HSAEpi cells and negative controls (non-reverse transcribed mRNA, -RT).