
Figure 7.
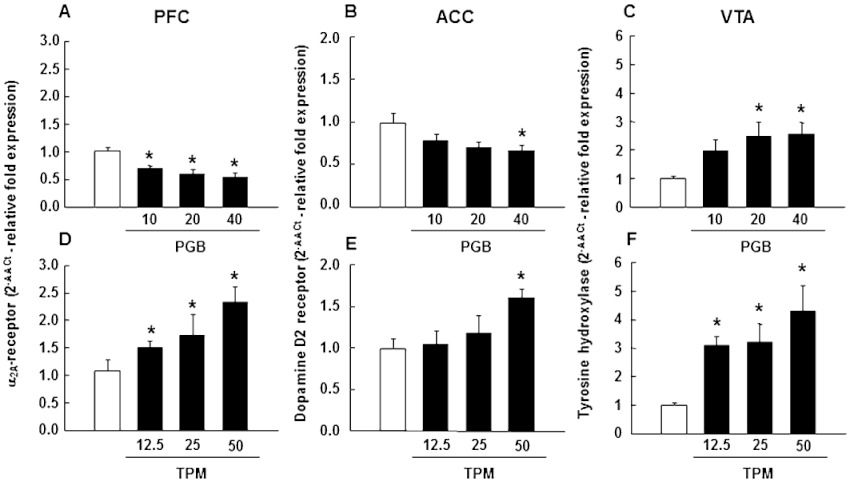
α2A-adrenoceptor, D2-receptor and TH relative gene expressions evaluation in the PFC, ACC and VTA, respectively, of pregabalin (10, 20 or 40 mg·kg−1, p.o., twice a day for 27 days)- or topiramate (12.5, 25 or 50 mg·kg−1, p.o., twice a day for 27 days)-treated mice by real time-PCR. Columns represent the means and vertical lines ± SEM of relative (2−ΔΔCt method) α2A-adrenoceptor gene expression in PFC (A,D), D2-receptor gene expression in ACC (B,E) and TH gene expression in VTA (C,F) of DBA/2 treated mice. *Values of drug-treated DBA/2 mice that are significantly different (P < 0.05) from its corresponding vehicle group.