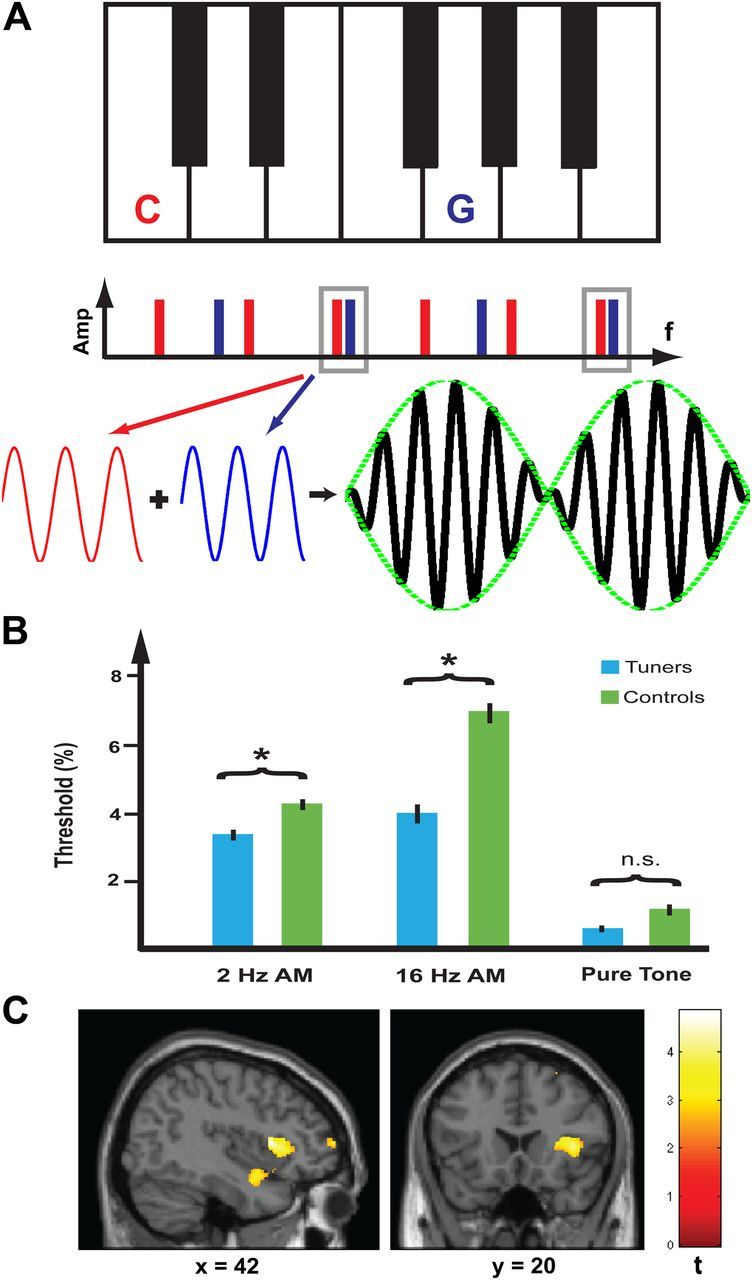
Figure 1.

Active listening to beats within particular spectral windows. A, Detection of beats in a spectral window for a two-note piano chord. A perfect fifth is shown between the notes C (red) and G (blue). This interval is so called because it spans five positions on the musical staff and corresponds to a seven-semitone pitch difference. When the popular equal-temperament tuning is used, in which the octave is divided into 12 exactly equal intervals, this corresponds to a pitch ratio of 27/12 that is approximately, but not exactly, equal to 1.5. This means that there is near coincidence of the third (and sixth) harmonic of C and the second (and fourth) harmonic of G. Because the harmonics do not coincide exactly beating occurs between them. For clarity, the beat amplitudes are shown as having the same intensity: the actual spectrum of piano notes shows increasing attenuation of the higher harmonics. The time waveform of the third harmonic of C (red) and second harmonic of G (blue) are shown below where they interact to demonstrate beat production as indicated by the amplitude modulated black waveform (envelope shown in green). Piano tuners are therefore required to listen selectively to beat rates that only occur in particular spectral windows and to adjust the beat rates to prescribed values (typically <20 Hz: Table 1) that specify the intervals. In this experiment, we tested a generic basis for this skill by requiring subjects to detect changing amplitude modulation of the third harmonic of a five-harmonic complex using beat rates within the range used by tuners (AM rate discrimination task). B, Mean thresholds for 19 piano tuners (depicted in blue) and 19 controls (depicted in green) are shown for the AM rate discrimination task at 2 Hz (3.26 ± 0.32% vs 4.17 ± 0.32%), 16 Hz (3.88 ± 0.57% vs 6.93 ± 0.60%), and a control task based on pure tone frequency discrimination (0.44 ± 0.10% vs 1.02 ± 0.33%). Mean thresholds for the 2 Hz and 16 Hz AM tasks were significantly different between the two groups while there was no significant difference between groups on the frequency discrimination task (see Results). Error bars indicate ±1 SE. C, Enhanced GM volume in piano tuners was found in the right planum polare and frontal operculum as shown in the sagittal section at x = 42. Greater GM volume in the frontal operculum is shown in the coronal section at y = 20. The strength of changes in GM volume (t value) is graded according to the color scheme on the right and shown at p < 0.001 (uncorrected).
