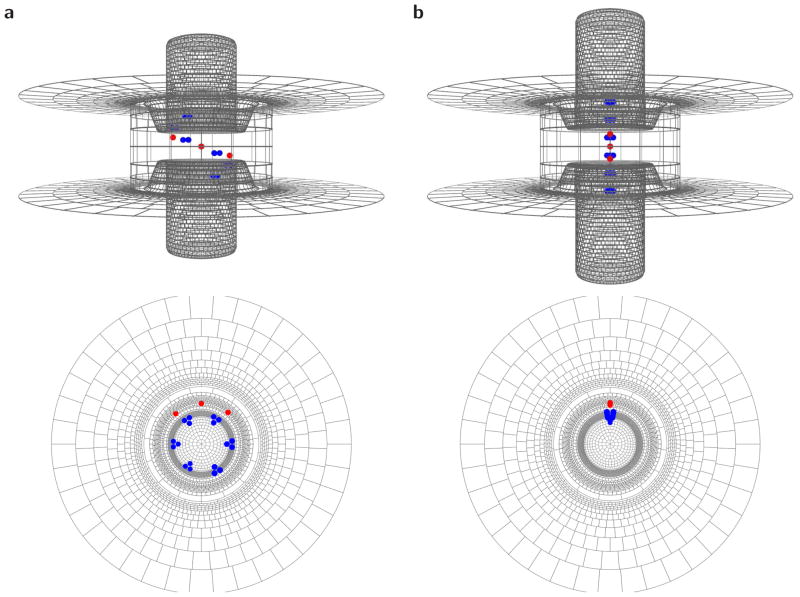
Fig. 2.
VS charge positions and dielectric boundary surfaces in an α-helical (a) and a 310-helical model (b). Blue symbols: S4 charges, each represented as three point charges of 1/3 e0; Red symbols: countercharges in the S2 and S3 segments, each represented as a single point charge of −1 e0. The dielectric boundary surface is divided into curved surface elements whose size is chosen dependent on distance from point charges and local surface curvature. This surface grid is used in solving the induced-charge calculation. The figure is drawn using perspective-enhancing features. The geometries shown here (a & b) reflect the base models in the geometry table (Online Resource S2, α (1) & 310 (1) respectively). For the range of motion of the S4 in these models, see supplementary animations (Online Resources S8 & S9, respectively)

