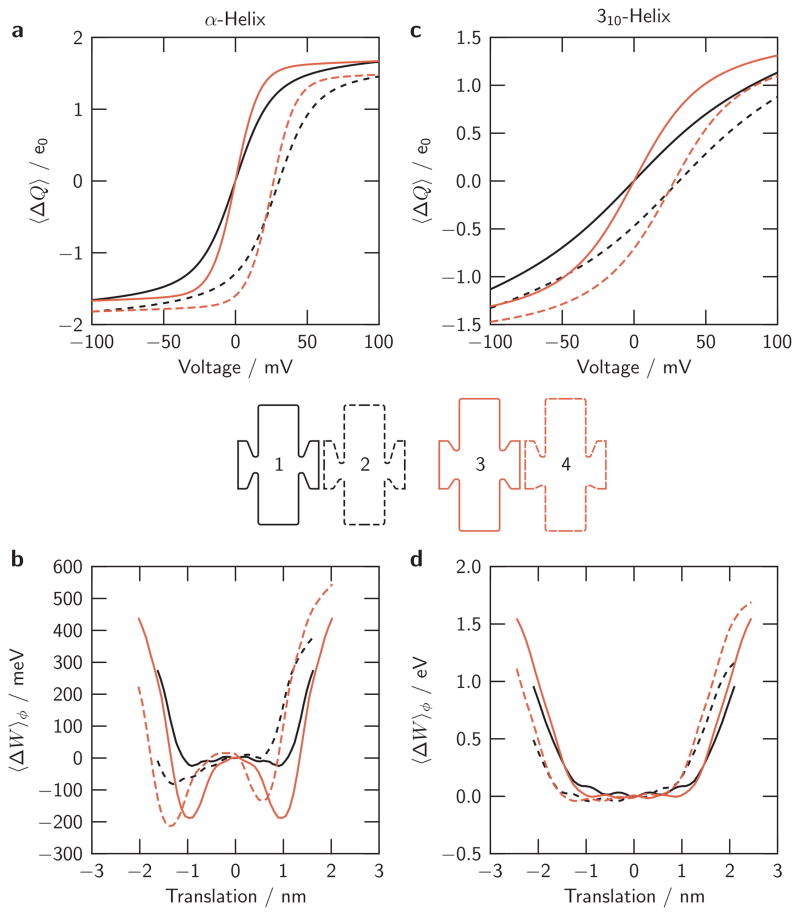
Fig. 6. Consequences of gating canal geometry.
Length and position of the gating canal (and hence its vestibules) are varied as shown by the outlines of the VS protein between the graphs. Outline 1 is our reference α-helical S4 model, with Outlines 2–4 being variations of that model as specified in the table (Online Resource S2), rows α (1–4). The line patterns & colors in both the graphs of the charge-voltage relations (a) and the underlying translational energy profiles (b) correspond to the line patterns & colors used for the outlines of the VS shapes. Outline 4 can be seen in a supplementary 3-dimensional figure (Online Resource S6). (c, d): the corresponding relations computed for the 310-helical model. Shapes 1–4 are as in the α outlines, remapped for 310 helices according to the geometry table (Online Resource S2), rows 310 (1–4)

