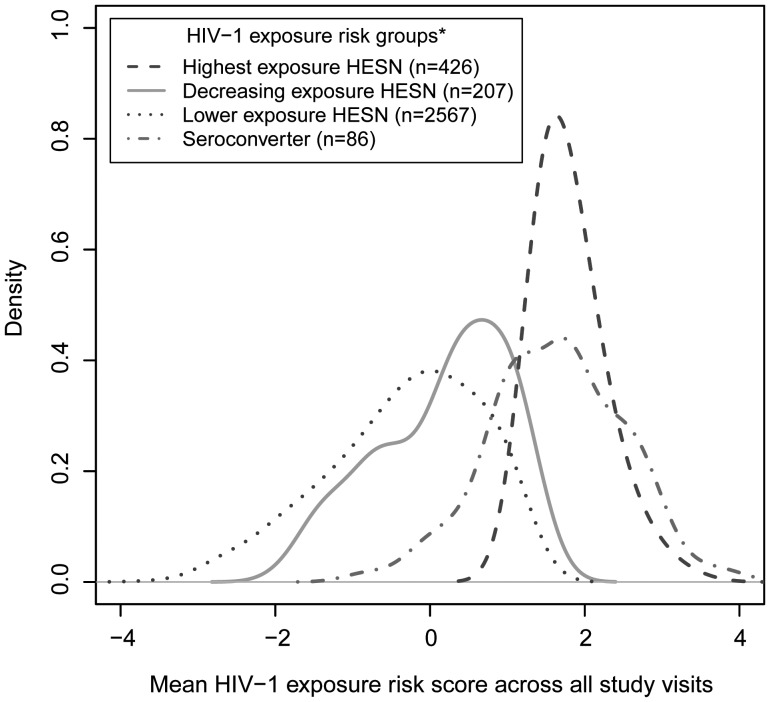
Figure 1.
Smoothed density curves representing human immunodeficiency virus type 1 (HIV-1) exposure score distributions for all HIV-1 seroconverters and HIV-1–exposed seronegative participants from the highest, lower, and decreasing exposure risk groups. Longitudinal HIV-1 exposure scores were quantified using time-dependent predictors (unprotected sex, plasma HIV-1 RNA levels, and symptomatic genital ulcer disease in HIV-1–infected partners and age, pregnancy, herpes simplex virus 2 serostatus, and male circumcision in HIV-1–exposed seronegative participants), with a 1-unit increase representing a exp(1)=2.7-fold increased risk of HIV-1 acquisition. HIV-1 exposure risk groups were based on individual exposure score trajectories over time and were created using longitudinal K-means cluster analysis. Area under the kernel density curves between 2 HIV-1 exposure risk scores represents the probability that exposure risk scores for individuals in the respective participant subgroup fell between those 2 values of the exposure score.

