Figure 7.
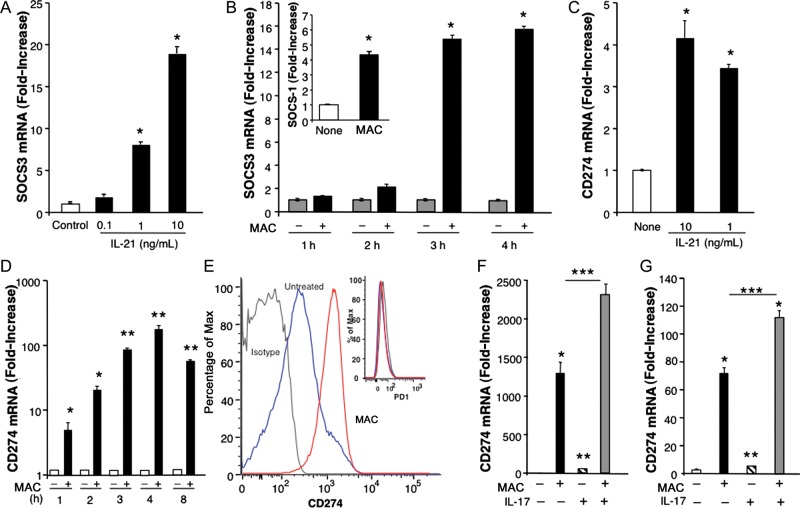
Expression of suppressors of cytokine signaling (SOCS) and CD274 by Mycobacterium avium complex (MAC) and MAC-induced cytokines. A, SOCS3 gene expression with and without exposure to exogenous interleukin 21 (IL-21) (*P ≤ .01; n = 3). B, SOCS messenger RNA (mRNA) levels in macrophages after no exposure or 1–4 hours of exposure to MAC, as determined by analysis of total mRNA levels (*P ≤ .01; n = 3). C, CD274 mRNA levels in macrophages with or without exposure to IL-21, as determined by real-time reverse-transcription polymerase chain reaction (RT-PCR) detection of CD274/PD-L1 (*P < .05; n = 3). D, CD274 mRNA levels in macrophage cultures with or without exposure to MAC alone for 1–8 hours, as determined by real-time RT-PCR analysis of total mRNA for detection of CD274/(PD-L1) (*P ≤ .05, **P ≤ .01 for no exposure vs MAC exposure; n = 3). E, Flow cytometry analyses of unexposed (blue line) and MAC-exposed macrophages (red line) for CD274 or PD1 (inset). The gray line denotes isotype. F, CD274 mRNA levels in monocytes with or without exposure to MAC and interleukin 17 (IL-17) for 4 hours, as determined by real-time RT-PCR (*P < .005 for no exposure vs MAC-only exposure, **P < .05 for no exposure vs IL-17–only exposure, ***P = .03 for both MAC and IL-17 exposure vs MAC-only exposure; n = 3) G, CD274 mRNA levels in macrophage cultures exposed to MAC and/or IL-17, as determined by real-time RT-PCR (*P = .002 for no exposure vs MAC exposure, *P = .002 for no exposure vs both MAC and IL-17 exposure, **P < .05 for no exposure vs IL-17 exposure, ***P < .05 for MAC-only exposure vs both MAC and IL-17 exposure; n = 3). Representative donor data are shown (n = 3).

