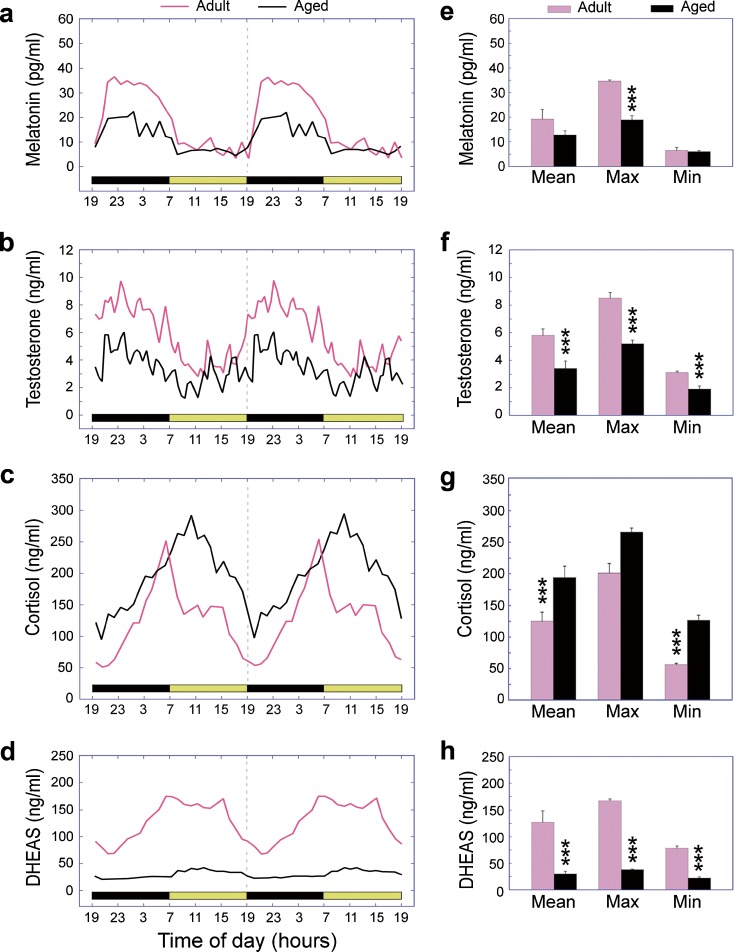
Fig. 1.
Age-related changes in the 24-h plasma concentrations of a melatonin, b testosterone, c cortisol, and d DHEAS in male rhesus macaques. The left panels depict mean hormone profiles from ten adult (~10 years) and ten aged (~26 years) animals, and the horizontal light and dark bars correspond to the 12L:12D lighting schedule; note that the profiles have been double plotted to facilitate observation of day–night differences. Each hormone showed a distinct 24-h rhythm, with a peak occurring either during the night (melatonin and testosterone) or early in the morning (cortisol and DHEAS). Statistical analysis of the hormone profiles is shown in the right panels. The mean, maximum (Max; average of five adjacent peak values), and minimum (Min; average of five adjacent nadir values) were calculated from each profile, and between-age comparisons were analyzed using Student’s t test. The bars represent the group means and the vertical lines represent SEMs. Note that in female rhesus macaques, plasma melatonin, cortisol, and DHEAS levels also show 24-h rhythms, but age-related changes are less clear. ***P < 0.001. Data adapted from Downs et al. (2004, 2008) and Garyfallou et al. (2005)

