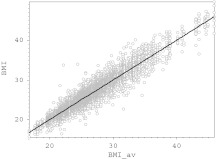
Fig. 3.
Correlation of the individual BMI measurements with average individual BMIAV for the entire follow-up period in the total Chingford Study sample. The variance decomposition analysis suggests that 9% and 91% of the total BMI variance are attributable to intra- and inter-individual variation, respectively. Correlation (r = 0.49, p = 0.0002) was found between the standard deviation of the repeated individual BMI measurements and individual average BMI

