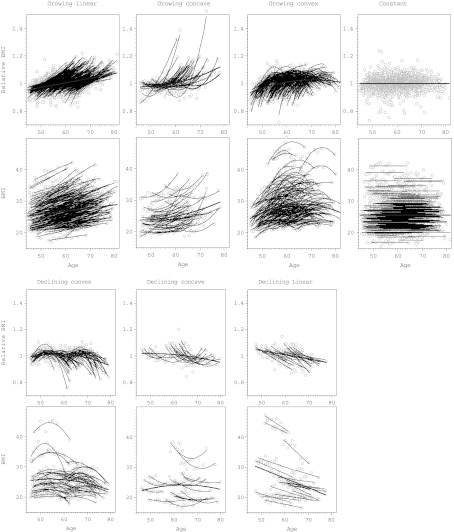
Fig. 4.
Longitudinal changes in BMI in relation to age in Chingford Study sample. The results presented for seven types of relation as defined in Fig. 1. For each type the upper graph shows relative BMI = BMI/BMIAV vs age, and the lower graph shows BMI in kg/m2

