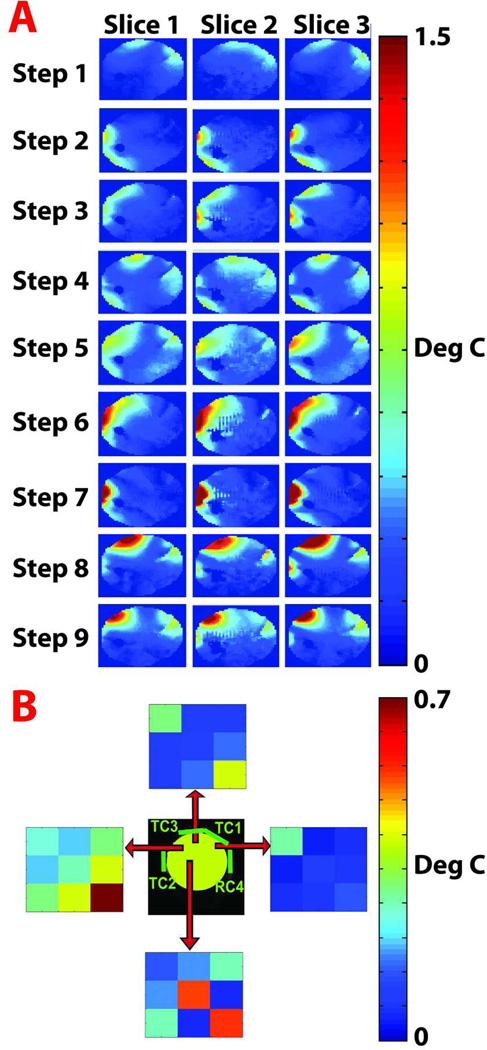
Figure 3.
Results of the experimental calibration procedure. A. Temperature difference maps measured for three slices in each step of the calibration process. Each step (each row of temperature change maps) corresponds to a different set of RF amplitude and phase weightings applied to each coil, as specified in Table 1. B. Absolute value of Λ matrix elements for four different voxel positions indicated by the origin of each red arrow.

