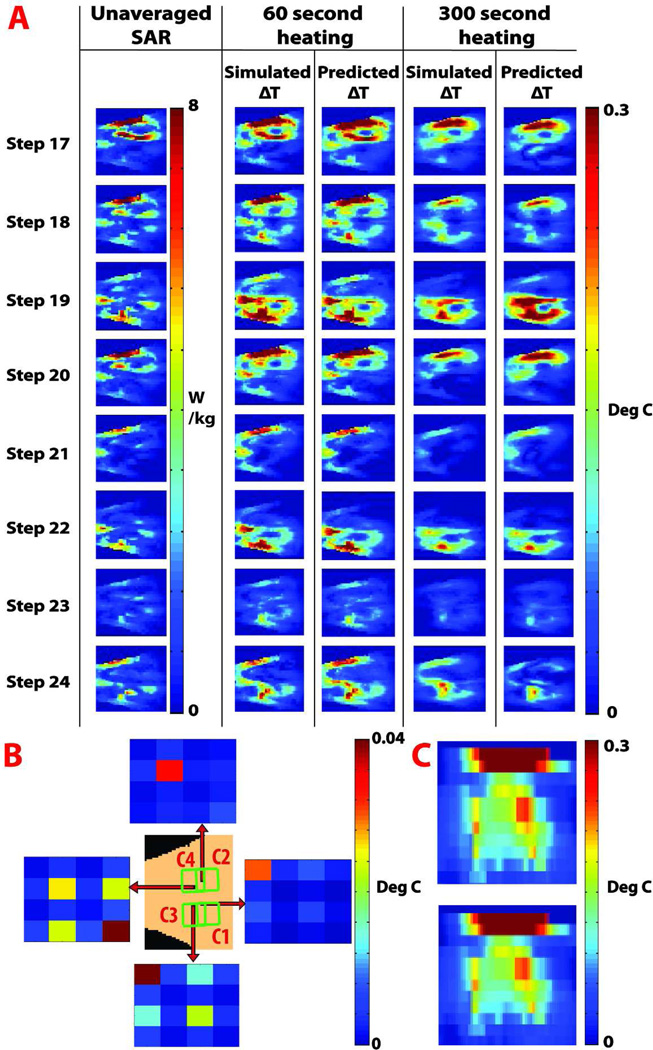
Figure 5.
RF heating in an emulated human body. A. Results of the prediction and validation procedure. Unaveraged SAR maps and directly simulated coronal temperature change maps are juxtaposed next to temperature change maps predicted using the calibrated heating prediction model, for each of the validation experiments 17–24 from Table 1. Results shown are for the 60 and 300 second heating cases at a coronal slice of interest. B. Results of the calibration procedure, illustrating the spatial dependency of the power correlation matrix Λ for a coronal slice of interest. 4 × 4 color plots represent the absolute value of Λ matrix entries, and each plot shows Λ at a different voxel position, indicated by the origin of the corresponding red arrows. C. Predicted (top) and directly quantified (bottom) temperature change map for an axial slice of interest, showing the prediction capability of the model in a deeper region inside the human body model, while accounting for perfusion and diffusion effects.

