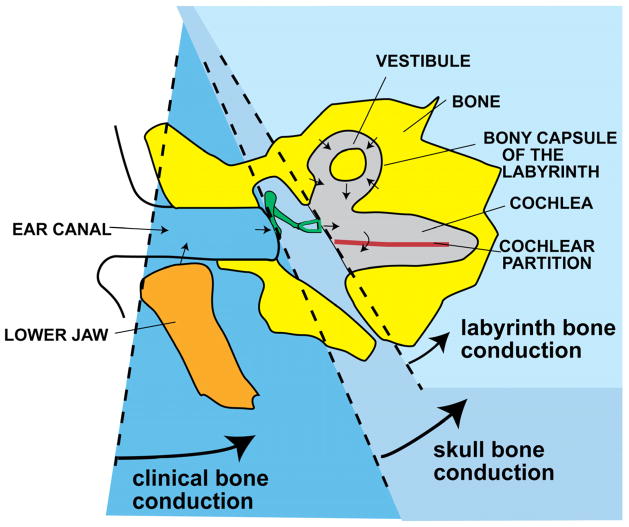
Figure 3.
Békésy’s scheme for conceptualizing the pathways contributing to hearing by bone conduction. The lightest blue area represents hearing sensation due to compression of the cochlear labyrinth; the medium-blue area represents the drive to ossiclular motion due to skull bone vibration, which also contributes to the first pathway; and the darker blue, clinical bone conduction, represents the contribution of lower-jaw movement to the first two pathways (reproduced from Békésy, 1954).

