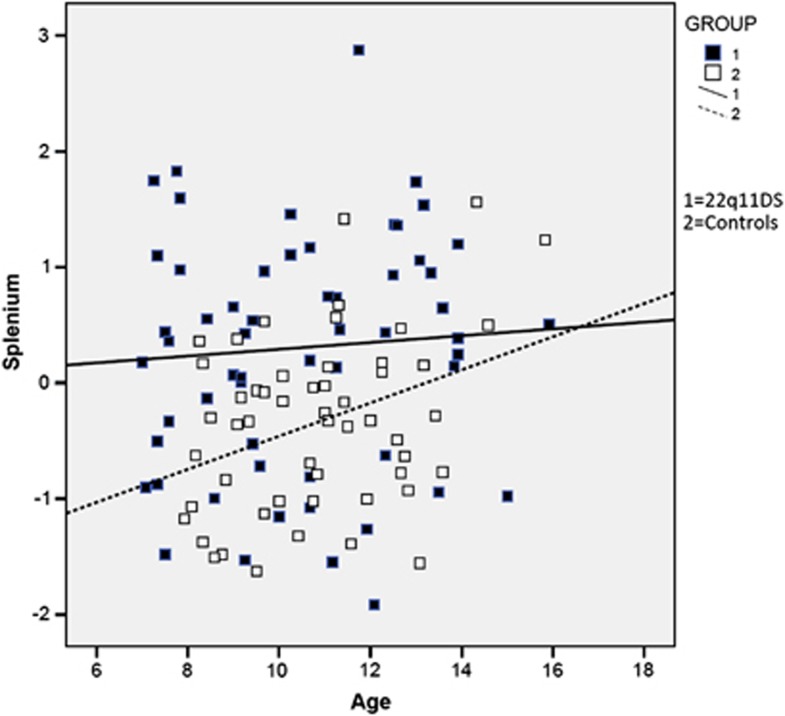
Figure 2.
Age and splenium correlations in the 22q11DS and control groups, demonstrating the correlation of age and splenium volume in the control group. The splenium volumes represent standardized Z-transformed scores. Note the lack of an age-related increase in the volume of the splenium in the 22q11DS group (R2=0.004) relative to the control group (R2=0.127).

