
FIGURE 2.
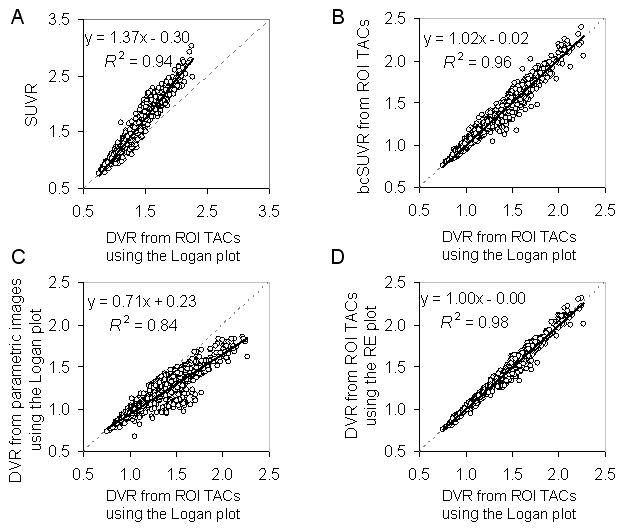
Linear correlations between the DVR estimates from the ROI TACs using the Logan plot and (A) SUVR, (B) bias-corrected SUVR (bcSUVR), (C) DVR from parametric images generated by the Logan plot, (D) DVRs from the parametric images generated by the relative equilibrium (RE) plot.