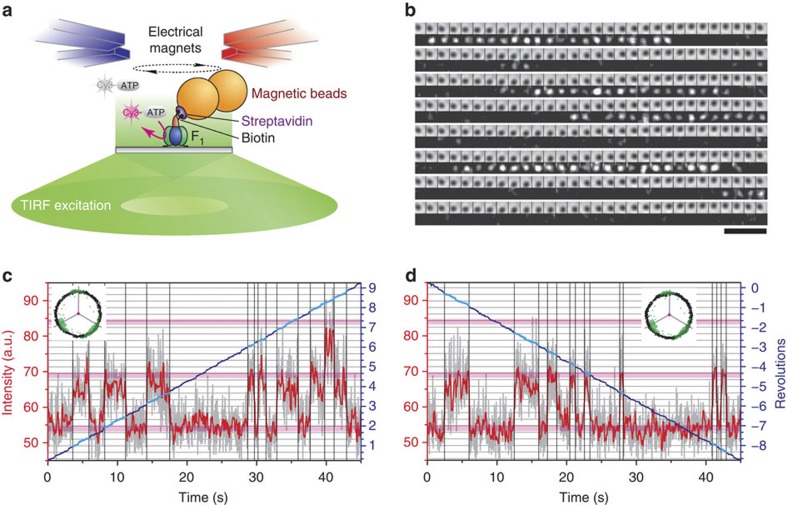
Figure 1. Simultaneous observation of manipulated rotation and Cy3-nucleotide binding.
(a) Experimental design (not to scale). Cy3-nucleotide was visualized by TIRF microscopy with conical excitation. (b) Sequential bright-field images, at 167-ms intervals, of magnetic beads (upper rows) and fluorescence images of single Cy3 molecules bound to F1 (lower rows) at 25 nM Cy3-ATP under a rotary magnetic field at 0.2 Hz in the hydrolysis direction. Images have been averaged over three frames (0.1 s) and, after dividing each pixel by 6×6, spatially averaged over 18×18 pixels (0.294×0.294 μm2). Scale bar, 5 μm. (c,d) Time courses of Cy3-ATP binding and bead rotation (0.2 Hz) in the hydrolysis (c) and synthesis (d) directions at 25 nM Cy3-ATP. Light-grey curves show fluorescence intensity in a spot of 8×8 pixels (0.784×0.784 μm2); red curves, after median filtering over eight frames (0.267 s). Pink horizontal lines, intensity levels for 0, 1 and 2 Cy3 molecules. Vertical black lines, binding or release. Blue curves, beads rotation, cyan parts with Cy3 bound. Horizontal grey lines, ATP-waiting angles separated by 120°. Insets, traces of bead centroid (green during unforced rotation in 60 nM ATP); grey radii, ATP-waiting angles.

