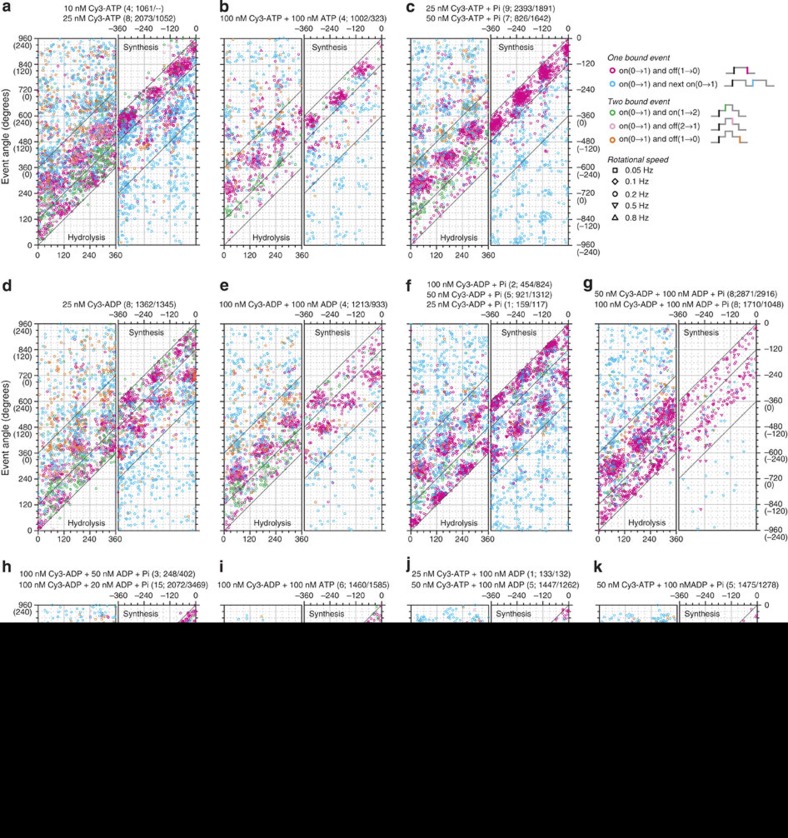
Figure 2. Angular distributions of all binding events.
(a) Cy3-ATP. The conditions shown at the top. Numbers in parentheses are the number of molecules observed and the number of rotations in the hydrolysis/synthesis directions. Horizontal axis is the angle of the first on event (site occupancy number 0→1), and the vertical axis the angle of subsequent events defined on the right of c. Left panels are for hydrolysis rotations (the angle increases), and right panels synthesis (the angle decreases). Simple binding events (magenta) are reproduced in Fig. 3. (b) Cy3-ATP+unlabelled ATP. (c) Cy3-ATP with 10 mM Pi. (d) Cy3-ADP. (e) Cy3-ADP+unlablled ADP. (f) Cy3-ADP with 10 mM Pi. (g,h) Cy3-ADP+unlabelled ADP with 10 mM Pi. (i) Cy3-ADP+unlabelled ATP. (j) Cy3-ATP+unlabelled ADP. (k) Cy3-ATP+unlabelled ADP with 10 mM Pi.

